

Every August the financial press treats the Jackson Hole keynote as a market-moving event. I studied all 44 of them from 1982 through 2025.
The average close-to-close move is about a quarter of a percent. 63% up days. That’s roughly what any random stretch of market gives you.
Nothing before, nothing after
The worst one was down 3% in 2022. One other notable move. The rest are unremarkable in both directions.
The month after the speech shows nothing either, which makes sense. Late August and September are historically sleepy and often weak. The A team isn’t on the desk.
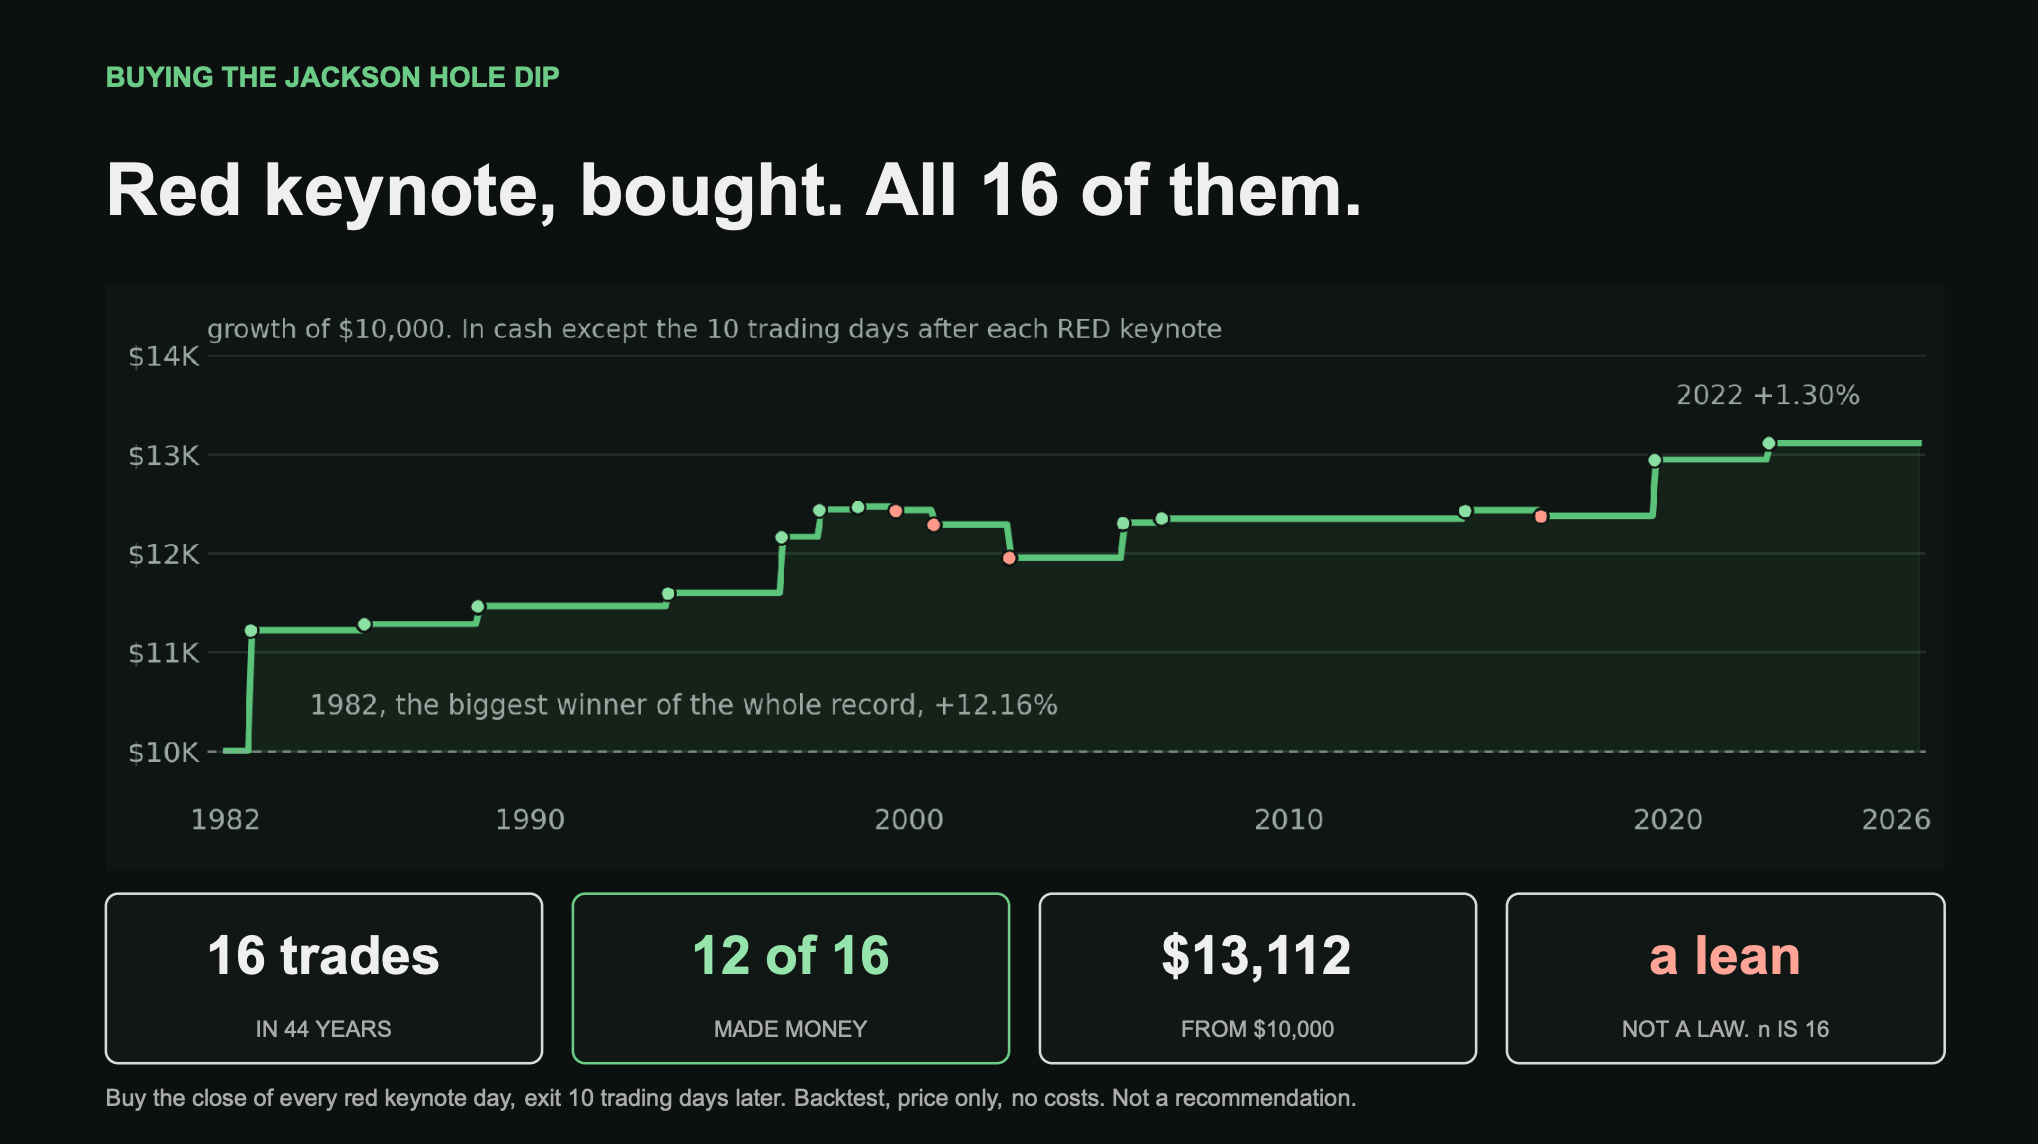
The one wrinkle
Of the 16 red days following a keynote, 12 were higher about ten days later.
I tested roughly 175 combinations of hold times, stops, targets and trailing stops. Nothing beat simply buying the close and holding around ten days. The useful part is that the sweet spot clusters across nine to twelve days rather than sitting on one lucky number, which is what you want to see before trusting anything.
The honest limits
Sixteen occurrences is a small sample and the edge is small. This is not a permanent system, it’s too infrequent and too thin.
But the instrument is the S&P 500. If it goes to zero overnight I have larger problems than one trade.
The plan
If we close red, I buy a small position, hold around ten days, no stop, no target. If it rips 2 or 3% I take some off early.
And I’m not chasing new highs into September. The data says there’s nothing there.
Stats Edge Pro. $149.99 a month, 30-day money-back guarantee.