
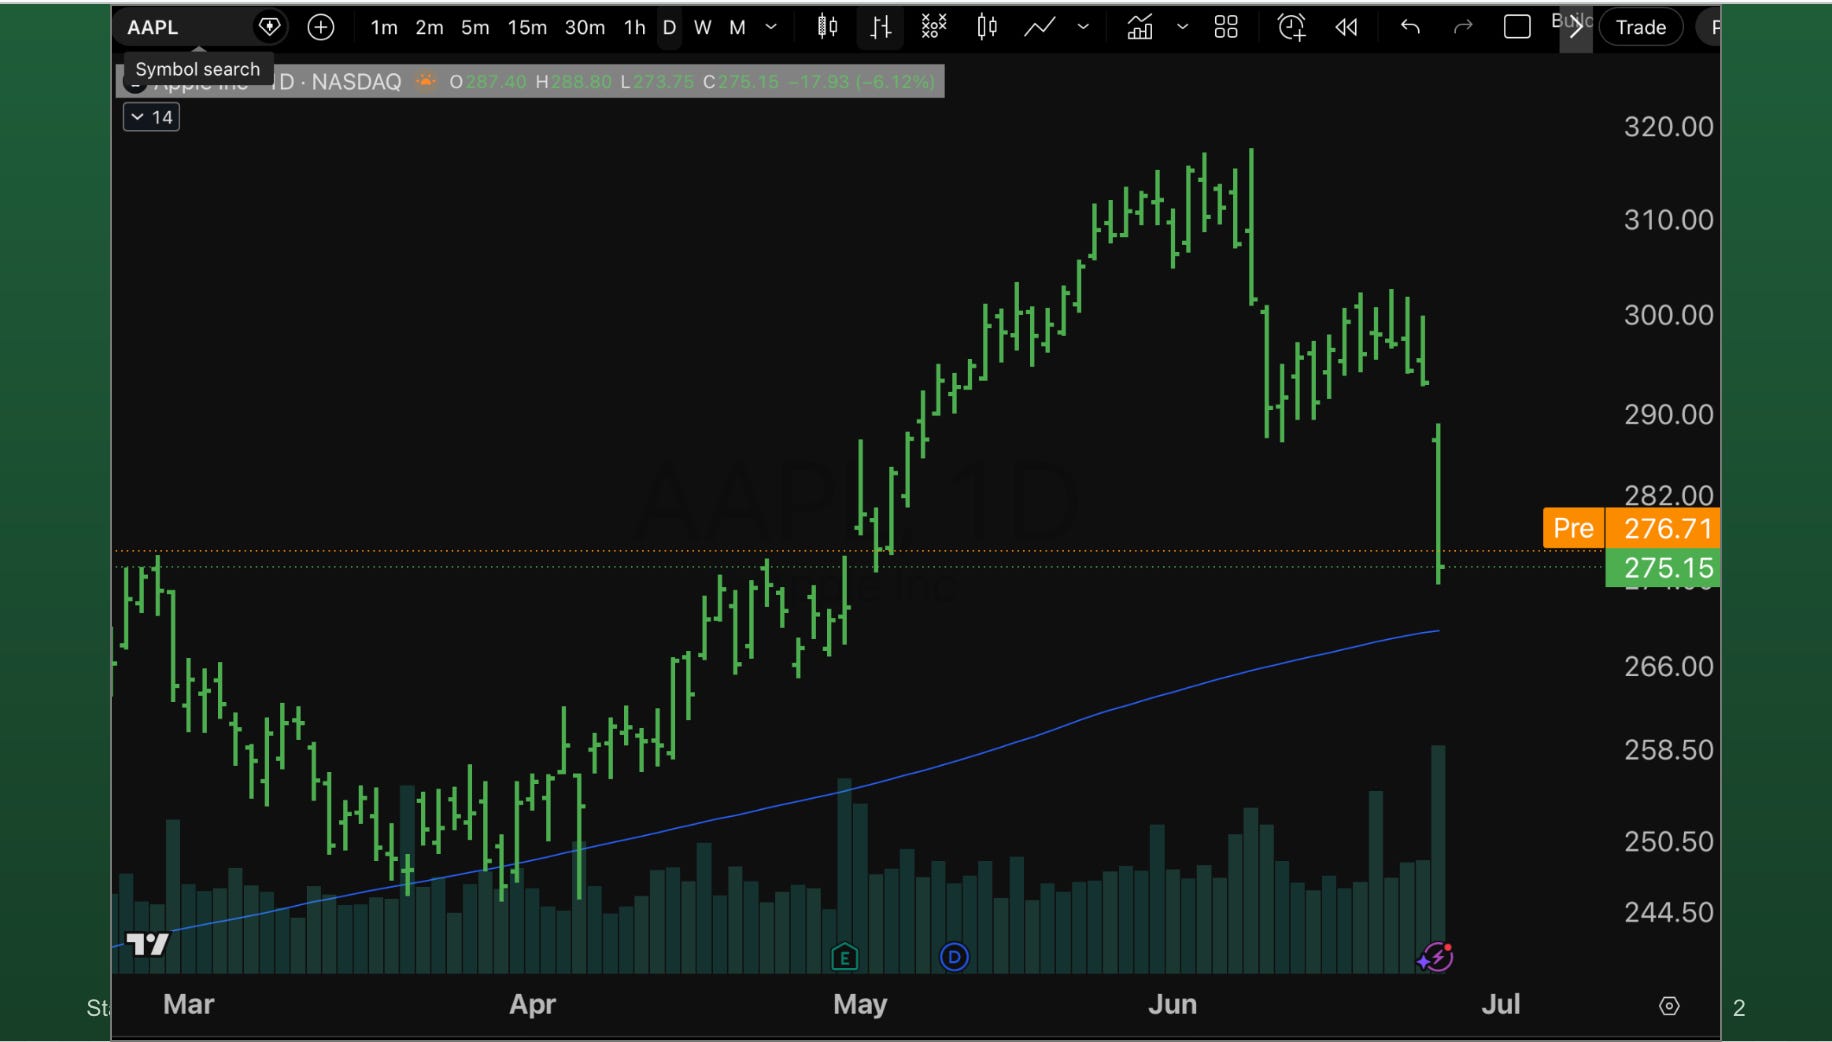
Apple dropped 5%. The data said the opposite of what I expected.
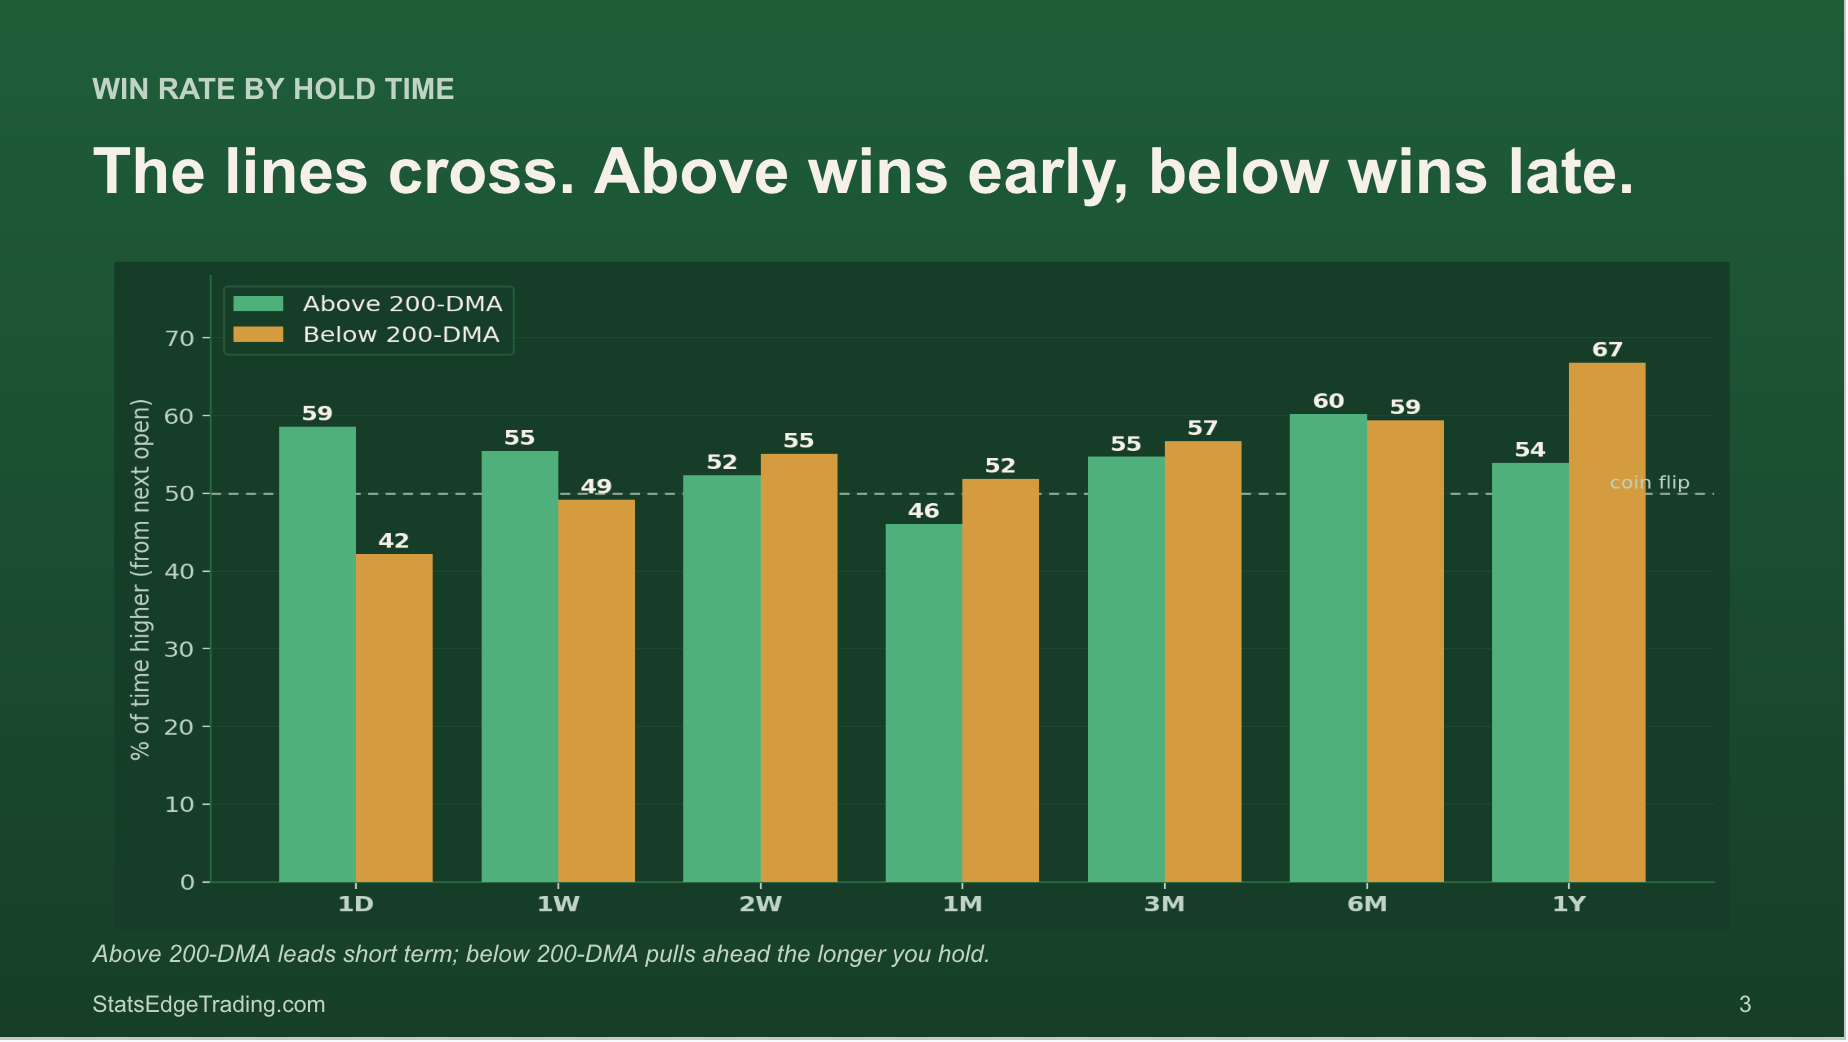
Above the 200-day, Apple bounces then bleeds. Below it, no bounce but a strong recovery. Backwards from what I assumed.

Apple fell over 5% yesterday. That’s happened 315 times since 1980, so there’s enough data to ask a real question: what tends to happen next?
I went in with an assumption. Apple’s a great company that drifts up over time, so a dip above the 200-day moving average should be the cleaner buy, and a dip below it should be weaker. The data said the opposite, and that’s why I love doing this.
Above the 200-day: there’s a 55 to 60% chance you’re higher a day or a week later. Nice short-term bounce. But stretch it out and it turns into a warning. A month later you’re down more often than up, and a year later only 54% higher, which is actually worse than Apple’s 68% baseline. A bounce that fades.
Below the 200-day: only a 42% chance you’re up the next day, so no short-term edge at all. But a year later you’re up 67% of the time with a median return around 14%. No bounce, strong recovery.
So above bounces then bleeds. Below flushes then climbs. Backwards from what I assumed, which is the whole point of running the numbers instead of trusting the gut.
This kind of small-edge trade is something I’m doing more of, statistics plus a read on the chart, tracked live.
Upgrade to Stats Edge Pro at $149.99/month, 30-day money-back guarantee.
— Michael Nauss, CMT, CAIA, CDMS