

Friday morning TTD 0.00%↑ opened at 12.87. Thursday it closed at 17.67. It finished the day at 13.80, down 21.9 percent, and this was 139.11 stock in December 2024. It now sits 51 percent below its long-term trend.
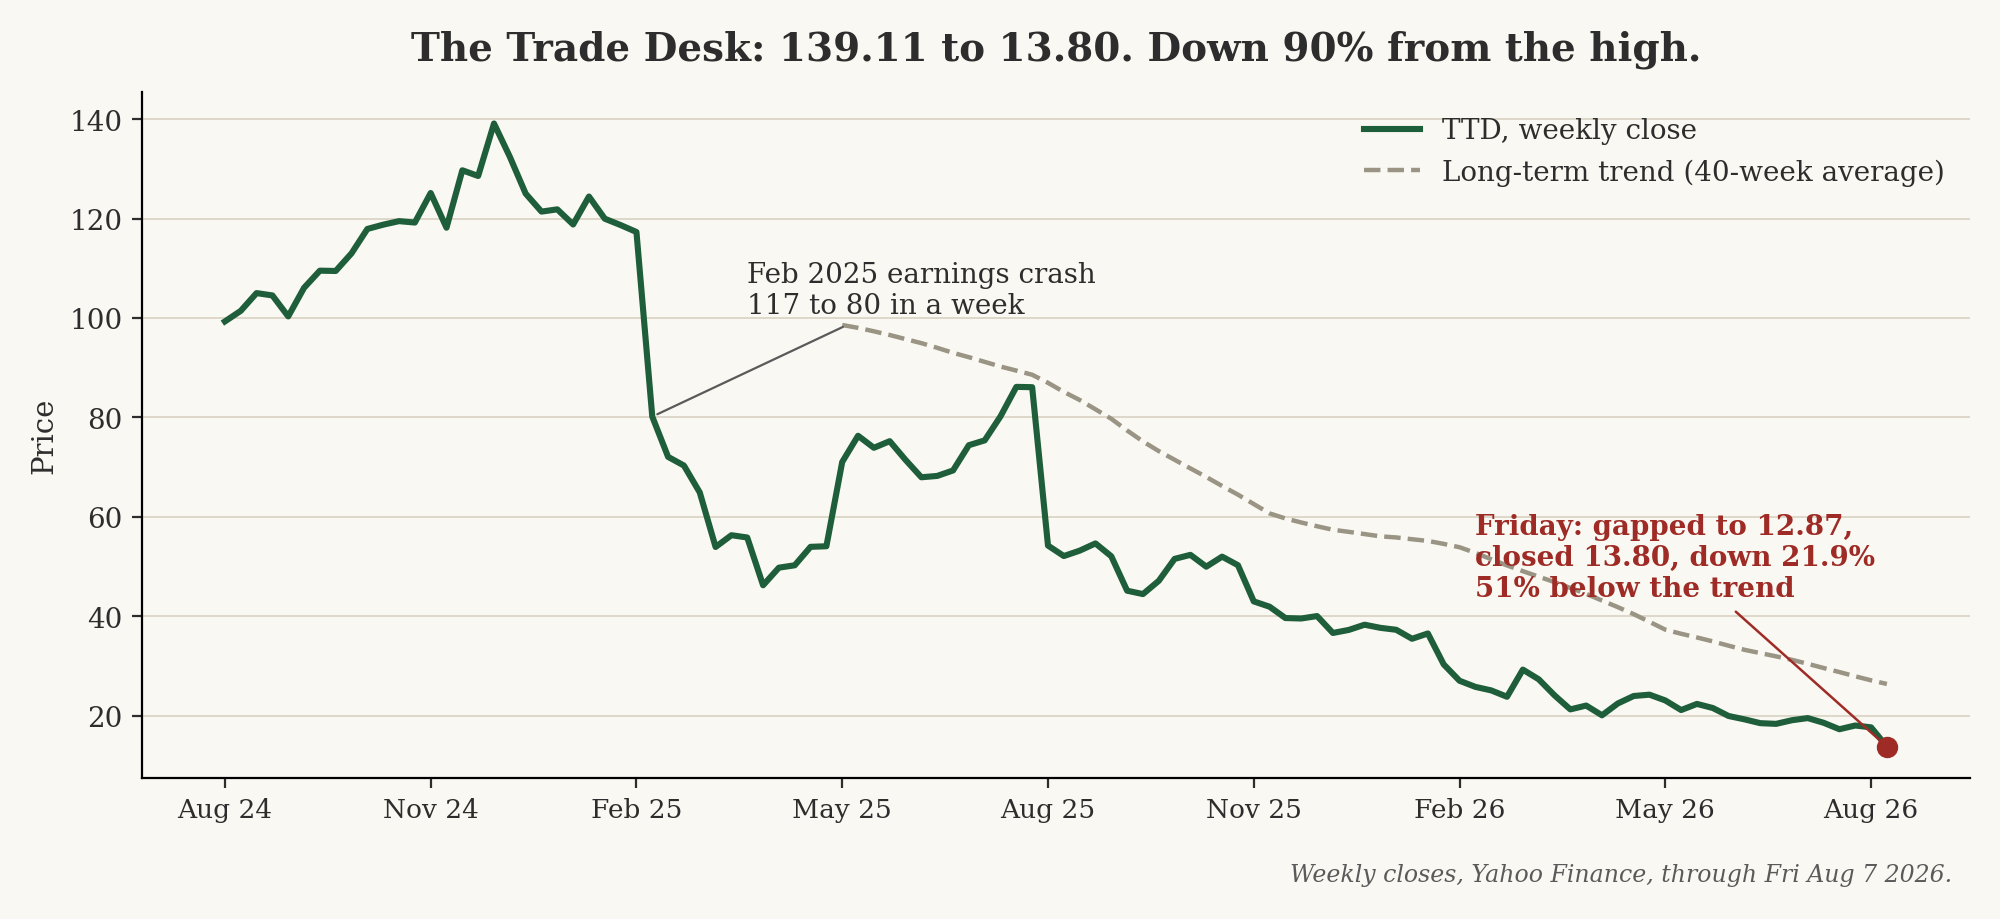
I did not find this trade. The nightly scan flagged it, and it tripped a rule we tested across 26 years of survivorship-free data before it was allowed near real money: a deep gap down on a stock that is already broken. Friday was the first live signal.
Here is what 238 of these did next, in liquid names:
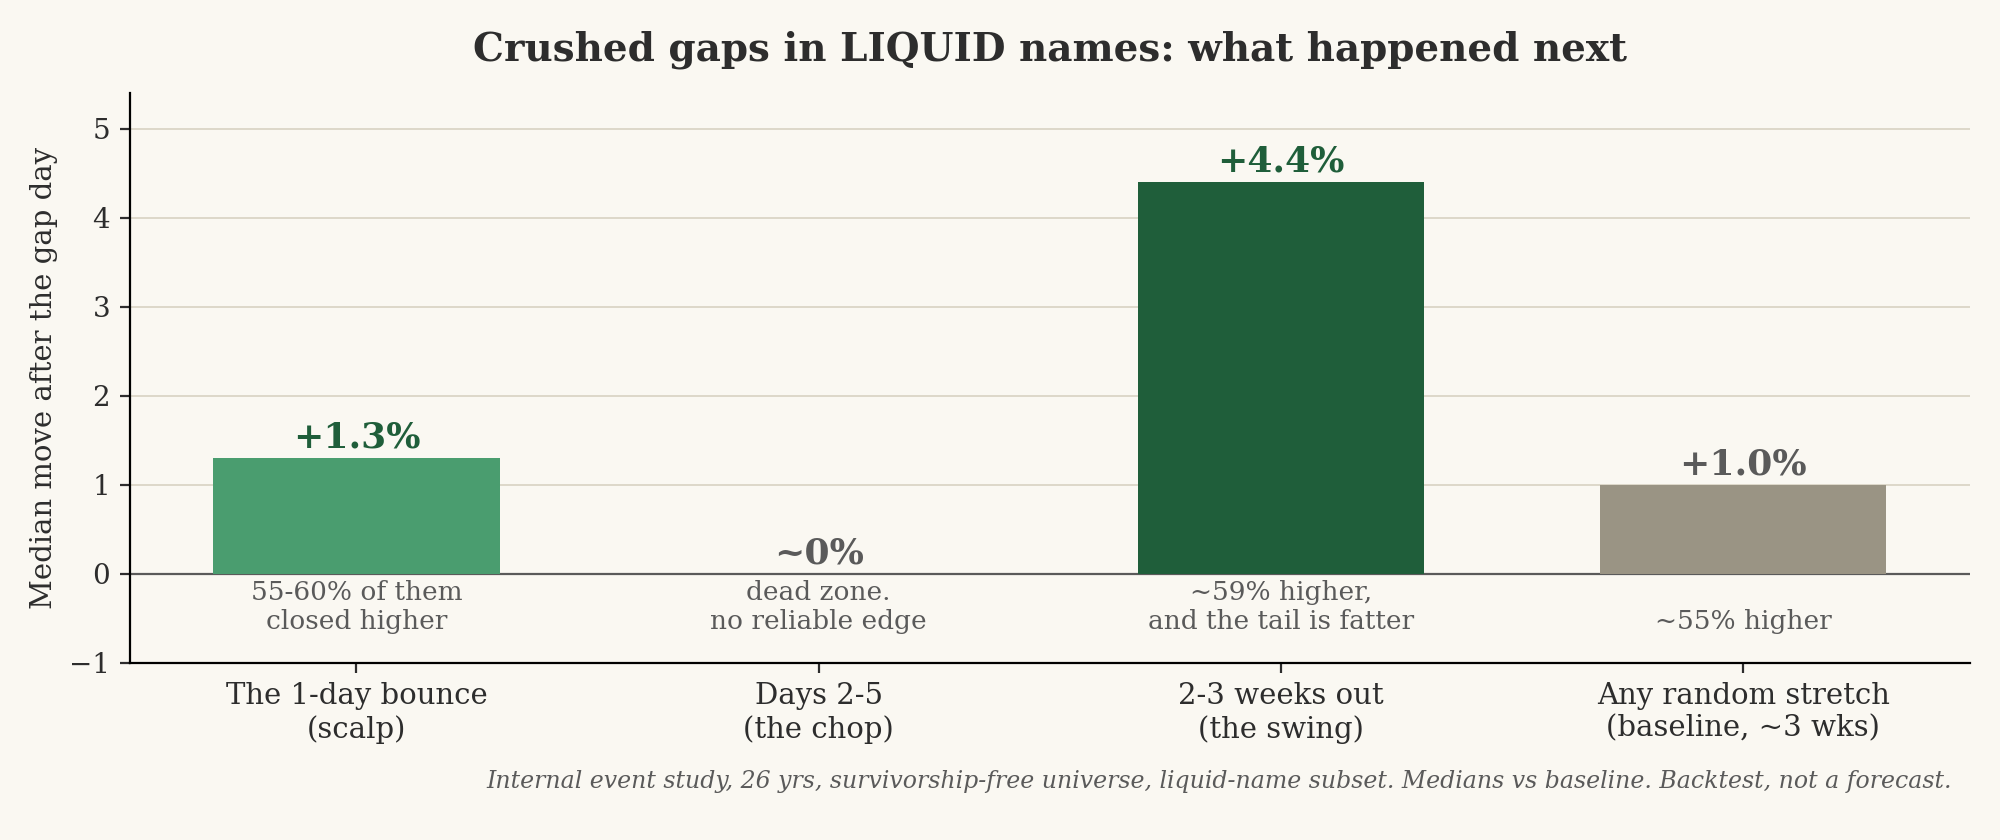
The next day: 55 to 60 percent bounce, median +1.3 percent. Days two through five: chop, no edge. Two to three weeks out: 59 percent higher, median +4.4 versus a 1 percent baseline.
The typical one makes 2.6 percent. The 90th percentile made 29. The edge is the tail, not the average.
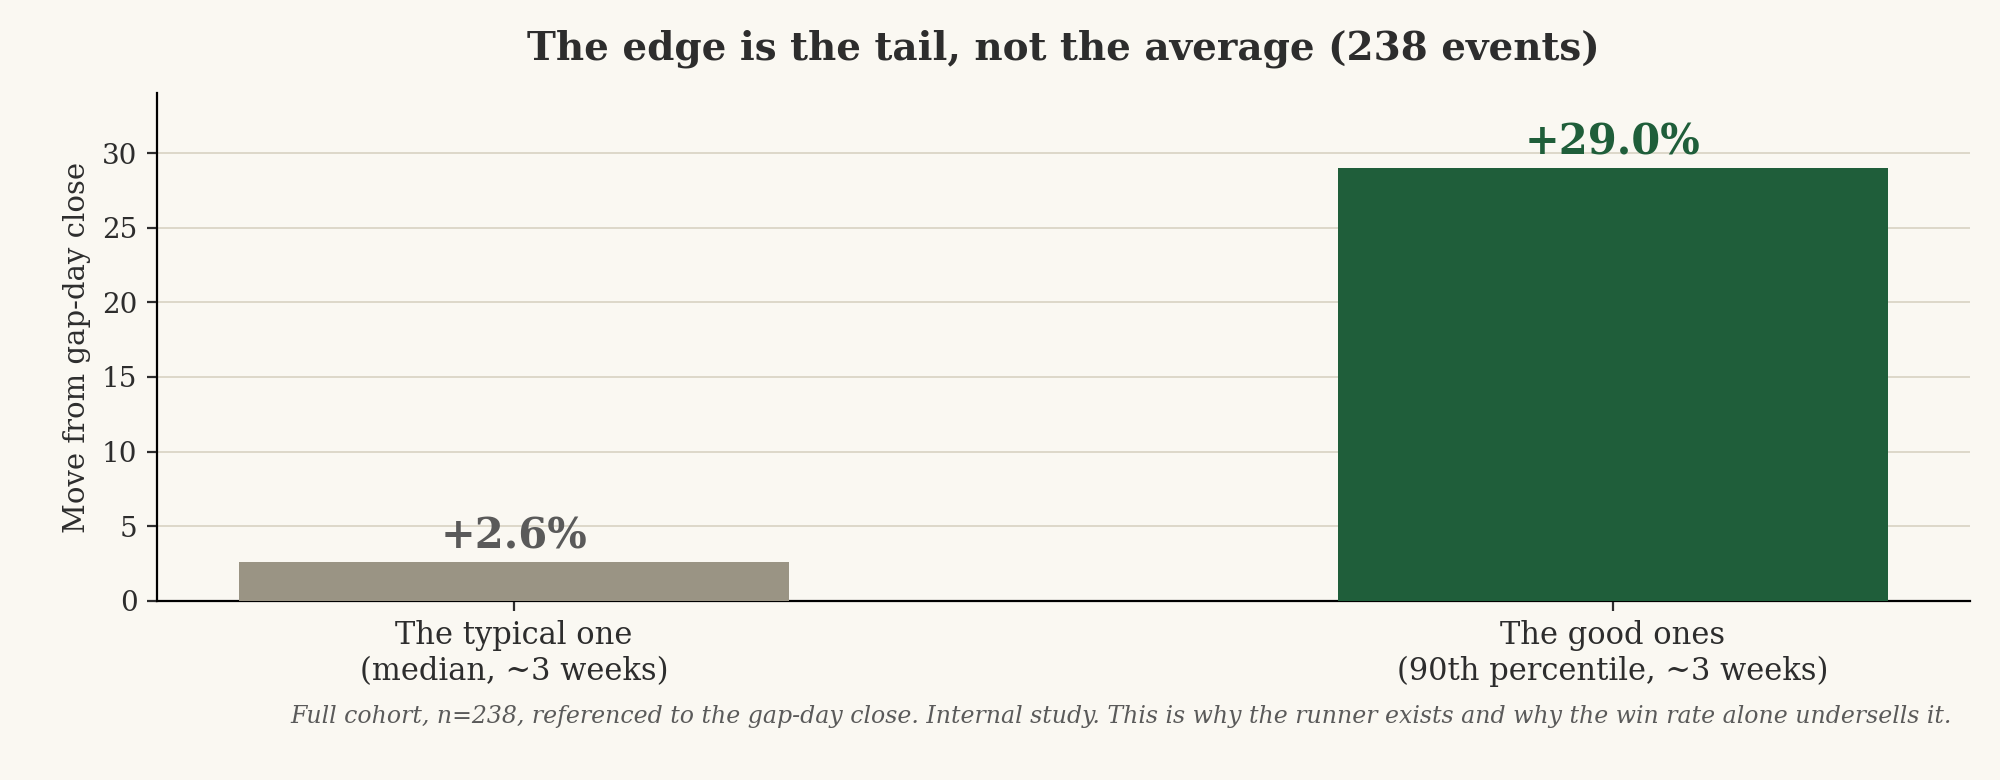
The honest part: this cohort is exactly where some stocks just keep falling, and TTD’s drop was a real guide-down, not a rumor. So this is a thin edge, sized tiny, and I am in it personally.
Below for members: my entry, the exact stop and why a normal stop is provably wrong here, the sizing math, and the put strike that pays you to buy TTD at my stop price.
