

Microsoft opened Thursday at $519.50, up 2.2%, and traded as high as $526.49. Then it gave it all back and closed at $498.30, down 2.0%, just above the day's low of $498.16. That's 10.3% under its high close of $555.80 on November 4.
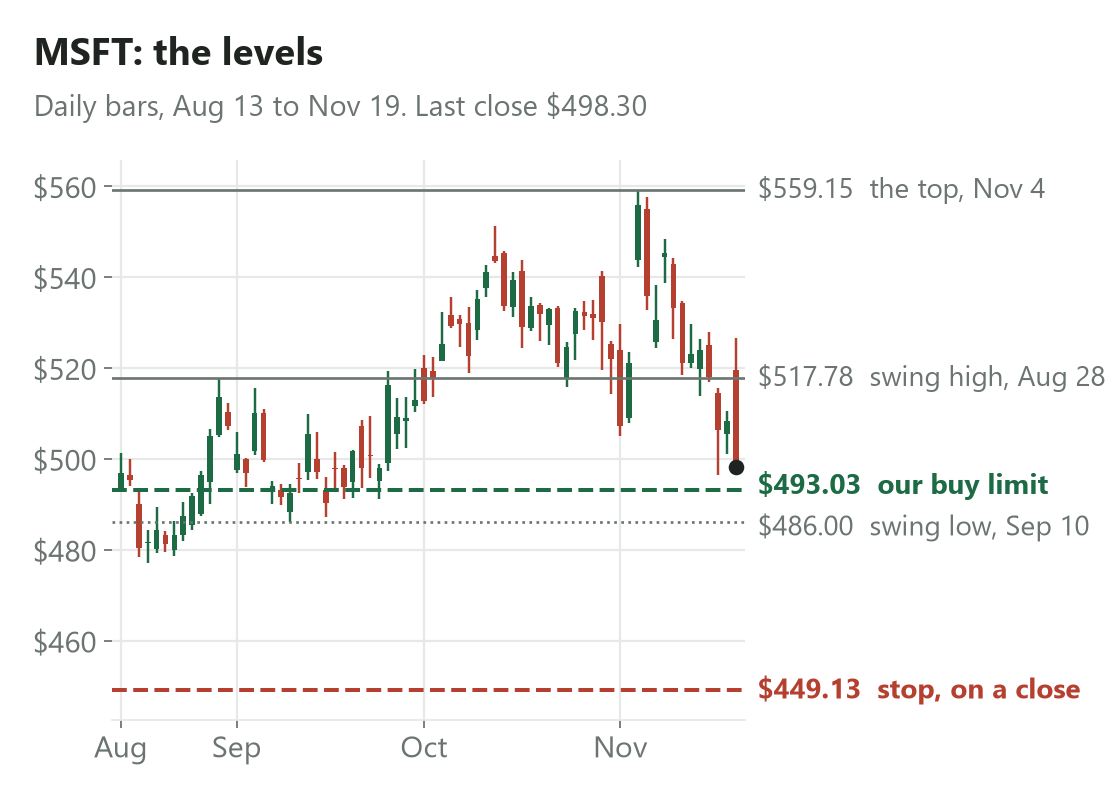
Our buy limit sits just under today's close. The stop sits well under the August and September lows.
So a stock that gives back a gap like that is done for now, right? Or you grab it at the close because it looks cheap.
Our buy limit is $493.03, about 1% under today's close, so it only fills if the selling keeps going on Friday. Overhead, $517.78, the August 28 swing high, is the first level to get back, then $559.15, where it topped out on November 4. Underneath, the September 10 swing low at $486.00 sits just under our limit, and our stop is a close below $449.13.
What the data says
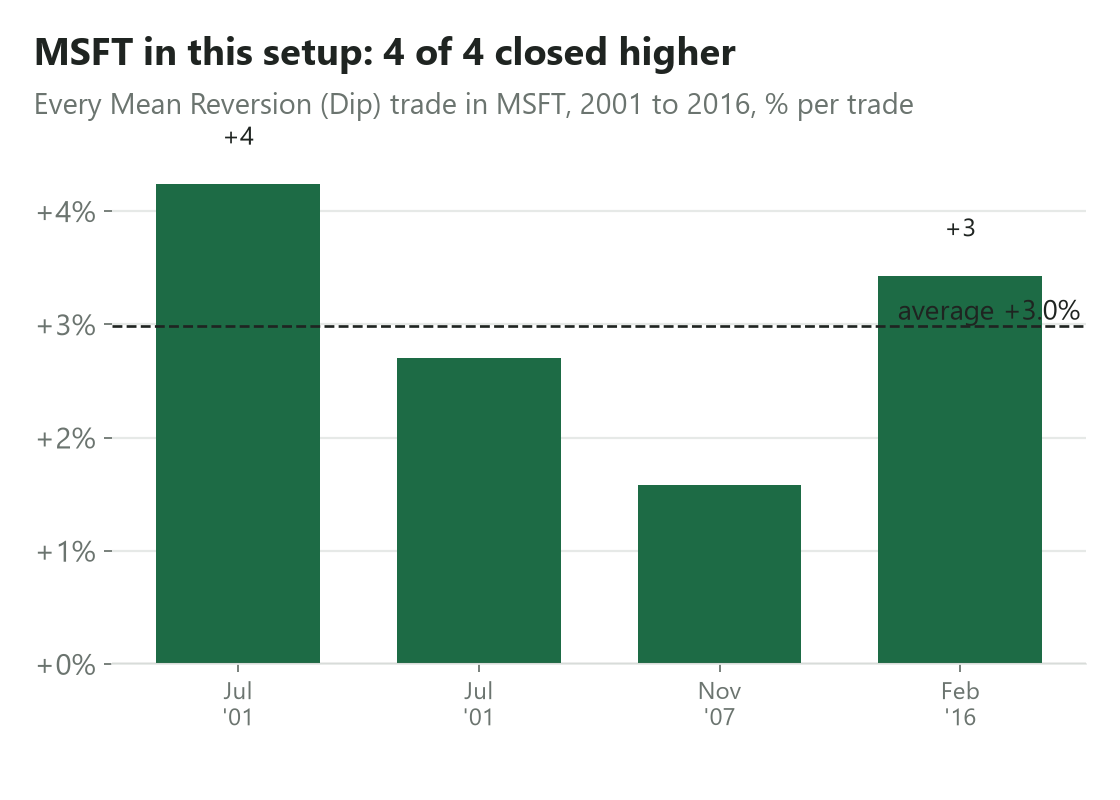
Microsoft has set this up 4 times since 2001. All 4 closed higher, +3.0% a trade on average. The last one was in February 2016.
Friday's free trade: MSFT
Buy. A limit at $493.03, good for Friday only. If it doesn't fill, there's no trade.
Size. About 2% of your account.
Take the bounce. After any close above the prior day's high, sell at the next open.
Stop. After a close beneath $449.13, sell at the next open. It isn't an order you place. Only a close counts. It assumes a fill at the limit; a lower fill lowers it by the same amount.
Time's up. If neither happens first, sell at the open on Thursday, December 10.
Record. 2,044 trades since 2001, 69% winners, +1.55% a trade, usually out in about 4 trading days.
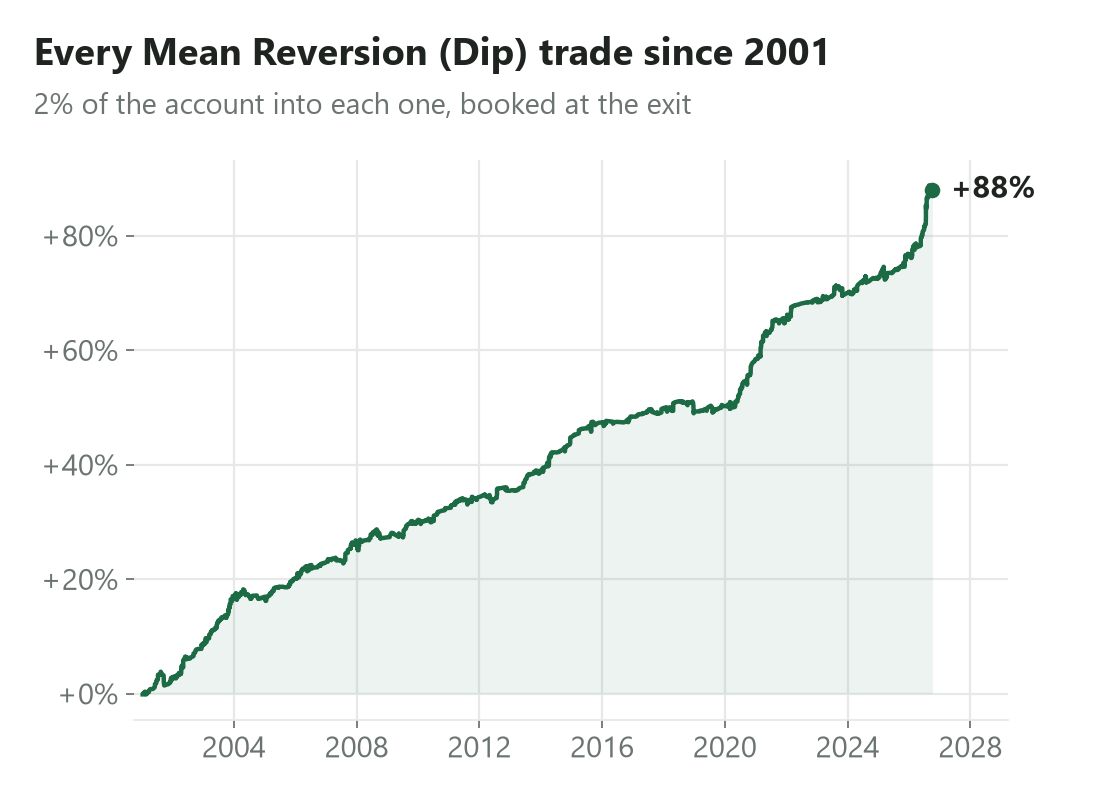
2% of the account into each trade, booked at the exit. Historical study on the Stats Edge Mean Reversion (Dip) backtest and Norgate daily bars, 2001 to Oct 2026. Before costs. Not advice.
Below the line: 2 more swing trades and 39 day-trade setups for Friday, with the exact entry, stop and exit for each, plus the stops and exits on our 12 open positions.