

Gold is ripping and we’re long. Here’s the reasoning behind it.
There’s a window from August through February with a physical cause. August and September bring jewelry restocking ahead of the buying season. Then Diwali, gift buying, wedding season, and post-harvest income all land in a stretch where buying gold is ritual. Western holidays and Chinese New Year carry the trend through the back half.
But seasonality alone isn’t a trade. It’s a tilt. We wait for price confirmation, which is why we skipped the earlier breaks that failed, and why we entered on the first genuinely strong day pushing into new highs.
Now the part that matters more than the setup. The headline stat is around a 77% win rate, and I’ll tell you straight that 22 occurrences is not statistically bulletproof. Worse, the equity curve did essentially nothing from 2012 to 2024. Twelve flat years.
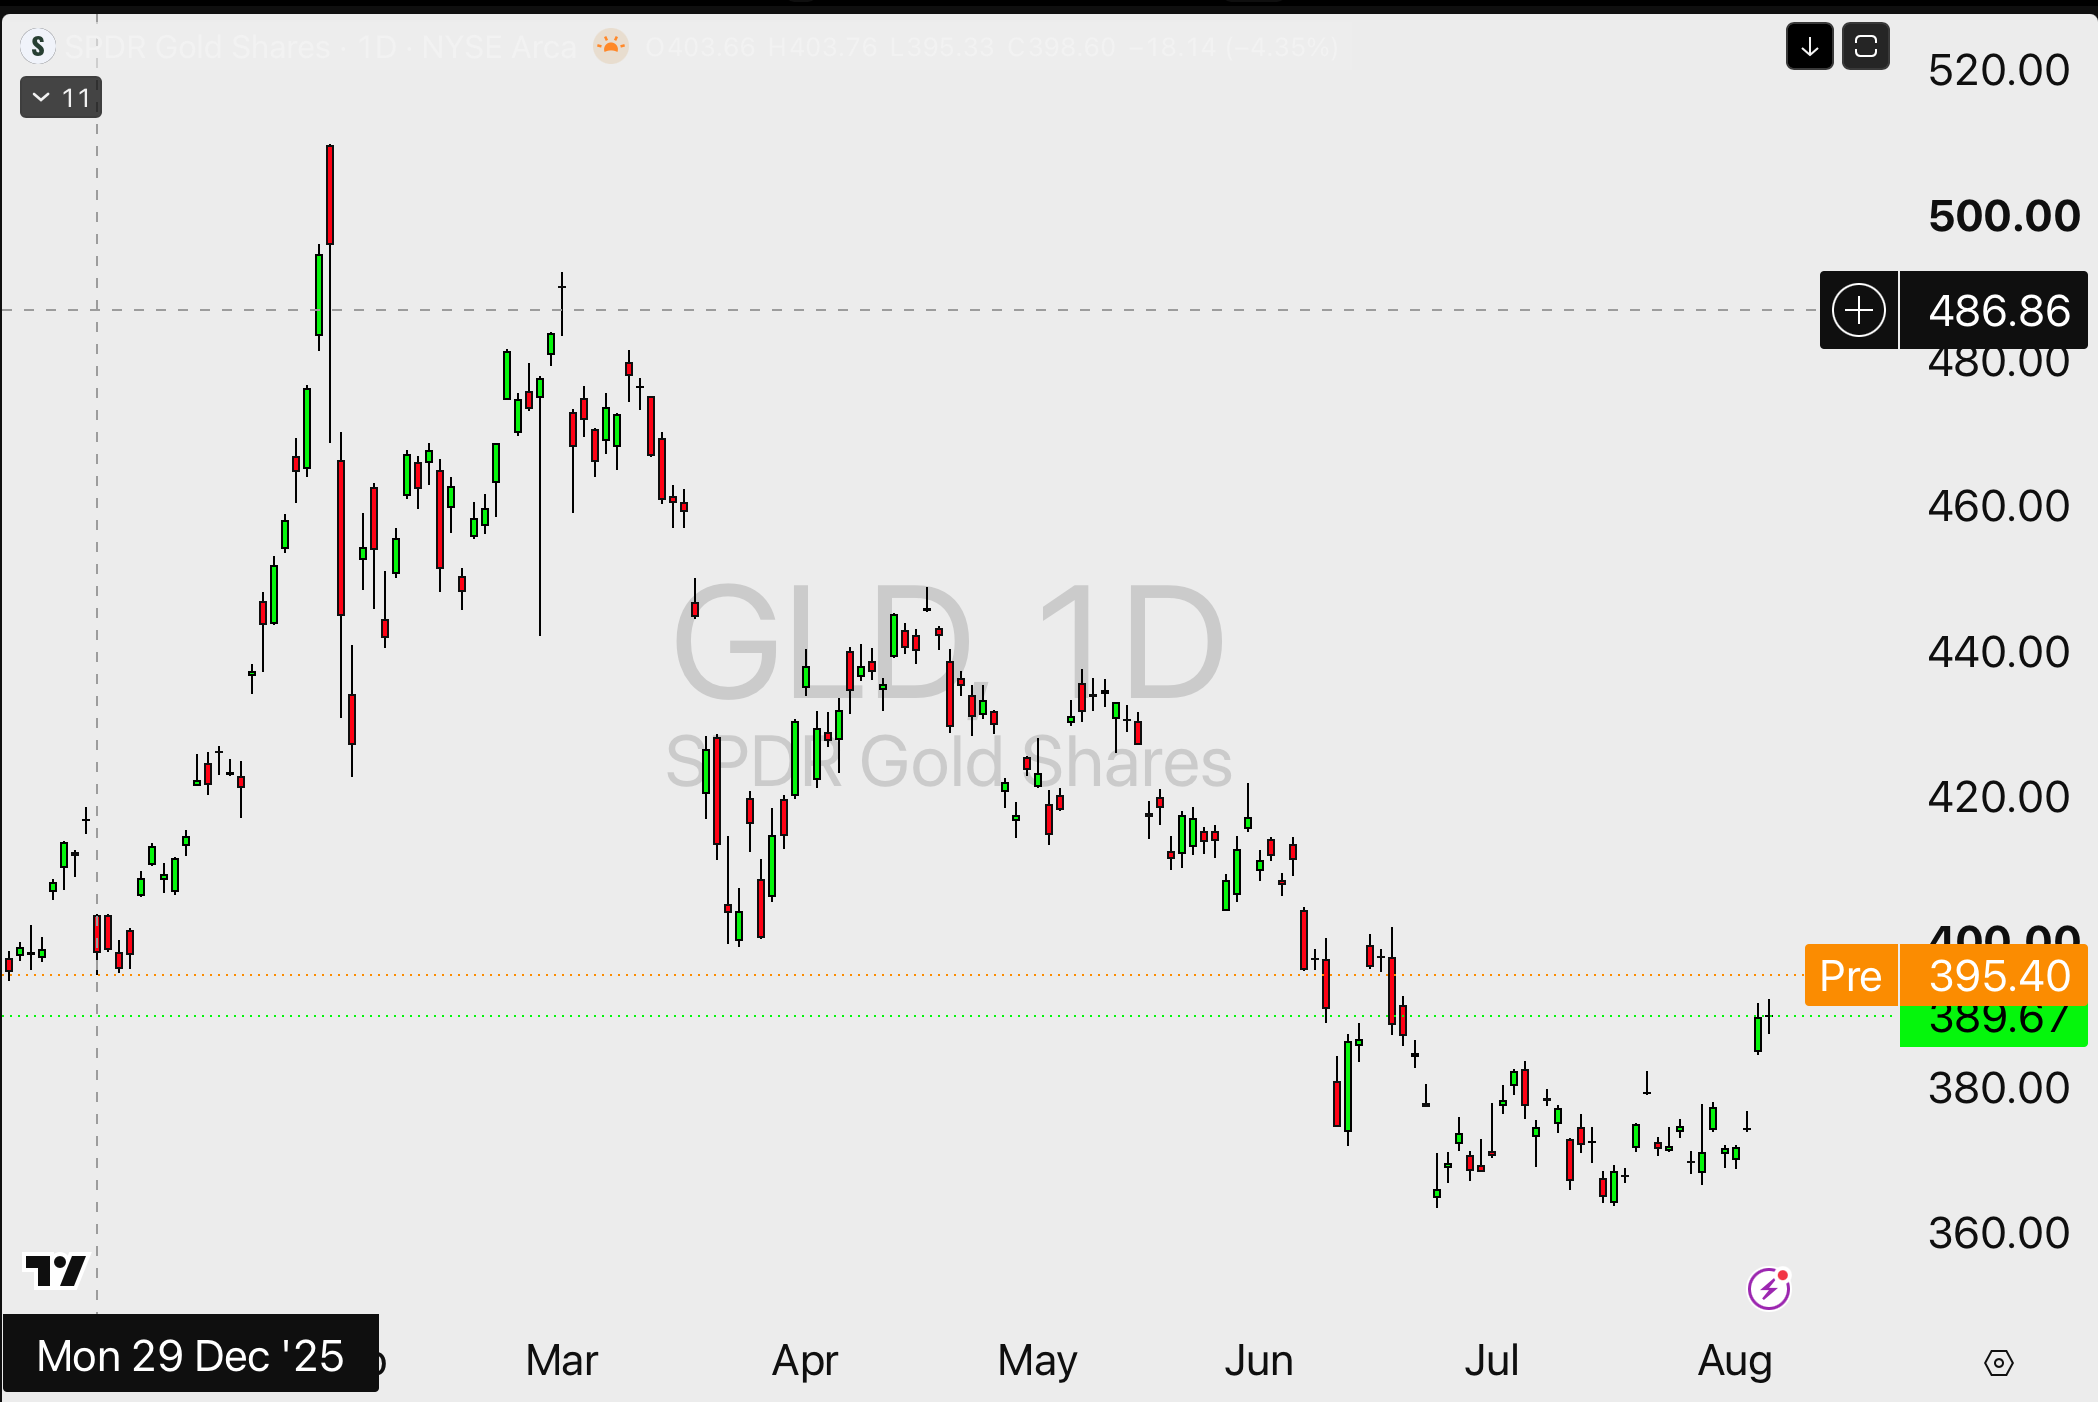
It worked in 2001. It worked in 2008. It worked in early 2020. It’s working now. Notice the pattern in those dates. This system pays when the rest of the portfolio is struggling, which is the entire reason it exists inside a portfolio rather than alone. On its own it would be unbearable.
This one has no stop, which will bother some people. It’s gold, not a biotech that can go to zero, and it’s a portfolio sleeve we hold for a stretch.
Every trade like this goes to members with the entry, the sizing, and the reasoning attached, and the losers get published too. That’s Stats Edge Pro, $149.99 a month, 30-day money-back guarantee.
Michael Nauss, CMT, CAIA, CDMS
Thanks Michael.