
IPO Spikes Don't Predict Crashes. IPO Droughts Predict Rallies.
IPO Spikes Don't Predict Crashes. IPO Droughts Predict Rallies.

Everyone’s watching the wrong side of the data. 25 years of IPO counts say the bears have it backwards.
Everybody on Twitter right now: “IPO season means the top is in. Institutions are dumping on retail. Get defensive.”
I ran the numbers. Not only is that wrong, the opposite appears to be true.
The IPO-spike-equals-top theory comes from one data point: the dot-com bubble. A huge spike in IPOs preceded the crash. Looks convincing on a chart. Until you realize that spike started in 1991 and the market quadrupled from there. If you’d gotten defensive at the first sign of IPO volume, you’d have missed a 4x move.
2008 bear market? No IPO spike before it. 2020 crash? No IPO spike before that either. The 2021 SPAC wave did precede the 2022 drawdown, but that’s an N of 2 across 25 years. Not a system. Not even close.
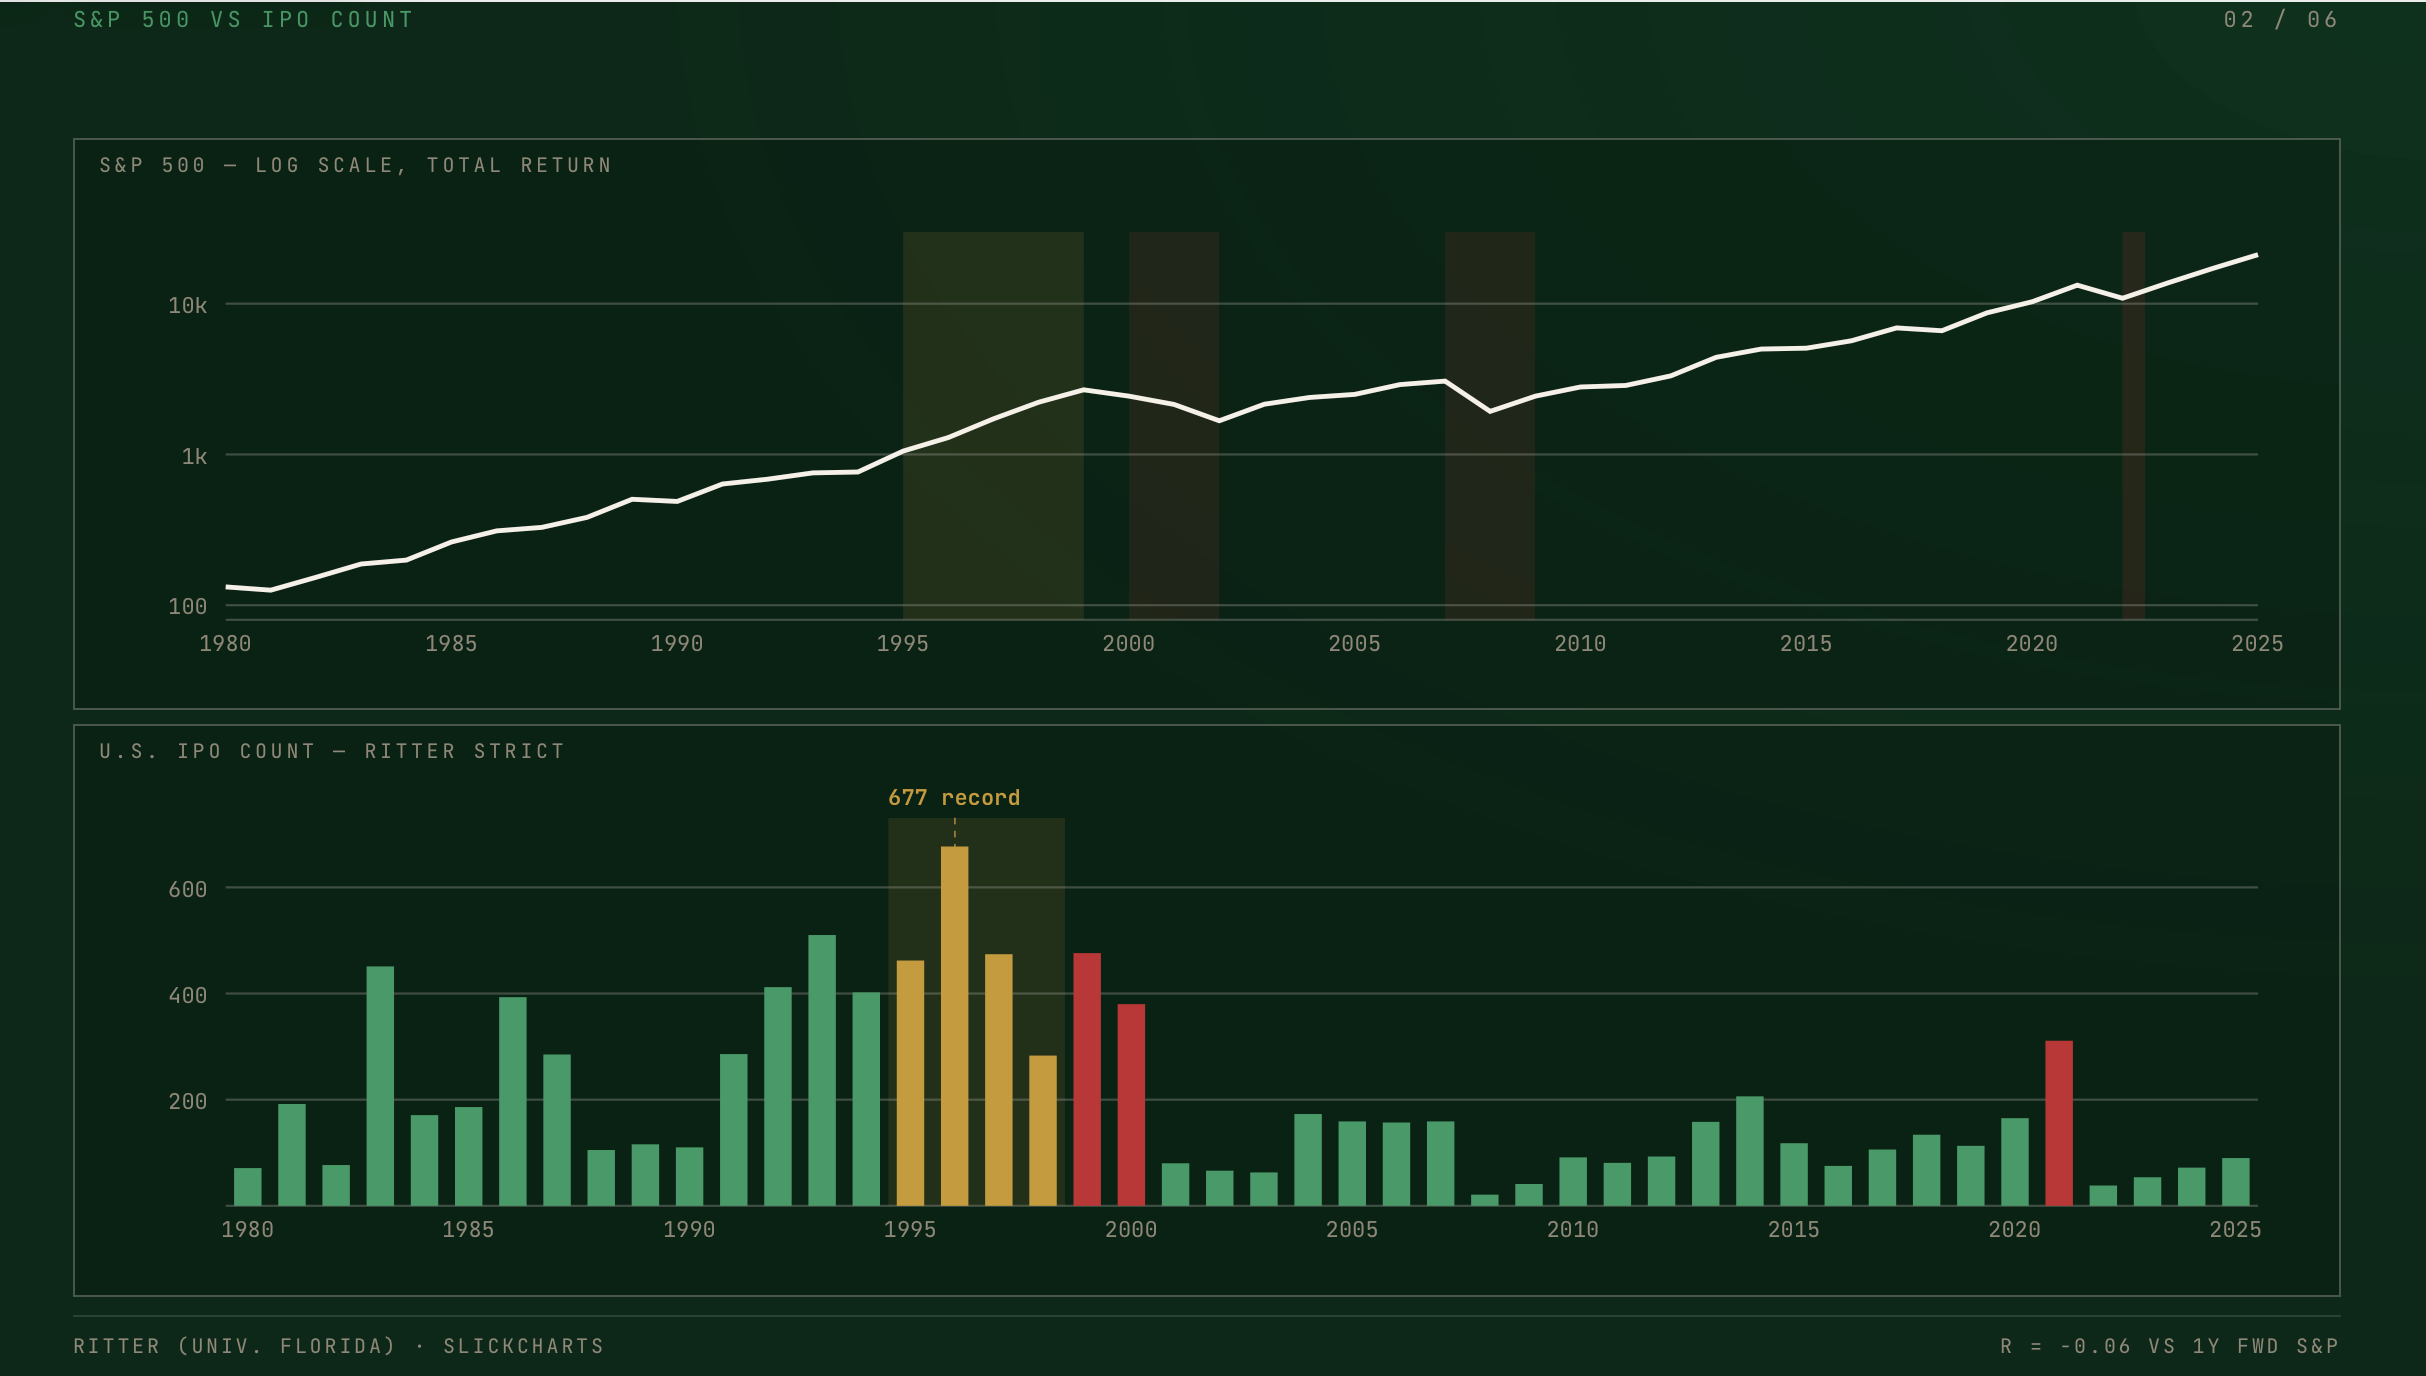
Here’s what the actual data shows. In years with heavy IPO activity from 1995 forward: 23% return, 20%, 33%, 28%. Average those out and you’re looking at roughly 25% forward returns in IPO-heavy years versus an 18% base case. You want to buy when there are lots of IPOs, not sell.
But the other side of this is where it gets interesting. When IPO volume drops 60-70% below normal, the market is almost always at the lows. Every time in the dataset. IPO drought in 2002, right at the bottom. IPO drought in 2009, right at the bottom. IPO drought in 2020, same thing. All but one of those years produced 20-plus percent forward returns.
Peter Lynch said more money was lost preparing for bear markets than in the bear markets themselves. This data is the proof. Everyone is so focused on calling the top that they’re missing the signal that actually works: when nobody wants to IPO, that’s when you should be buying.
If the numbers had shown IPO spikes were bearish, I’d be building a system to short them. The data says the opposite. That’s what we do at Stats Edge. We follow the numbers wherever they go, including into conclusions we didn’t expect. The systems have had drawdowns doing exactly this. I publish those in The Drawdown Memo. Not after. During.
The free 25-Year Backtest PDF at https://www.statsedgetrading.com/the-25-year-backtest covers the regime-testing methodology behind this kind of analysis. Same framework, applied to a market myth.
For real-time alerts across swing, day trading, and investing systems, that’s Stats Edge Pro at $149/month with a 30-day money-back guarantee.
— Michael Nauss, CMT, CAIA, CDMS