
Most Interesting Chart Of The Week
Low Bases

This week’s most interesting chart isn’t just one ticker — it’s a pattern we’re seeing again and again in this market.
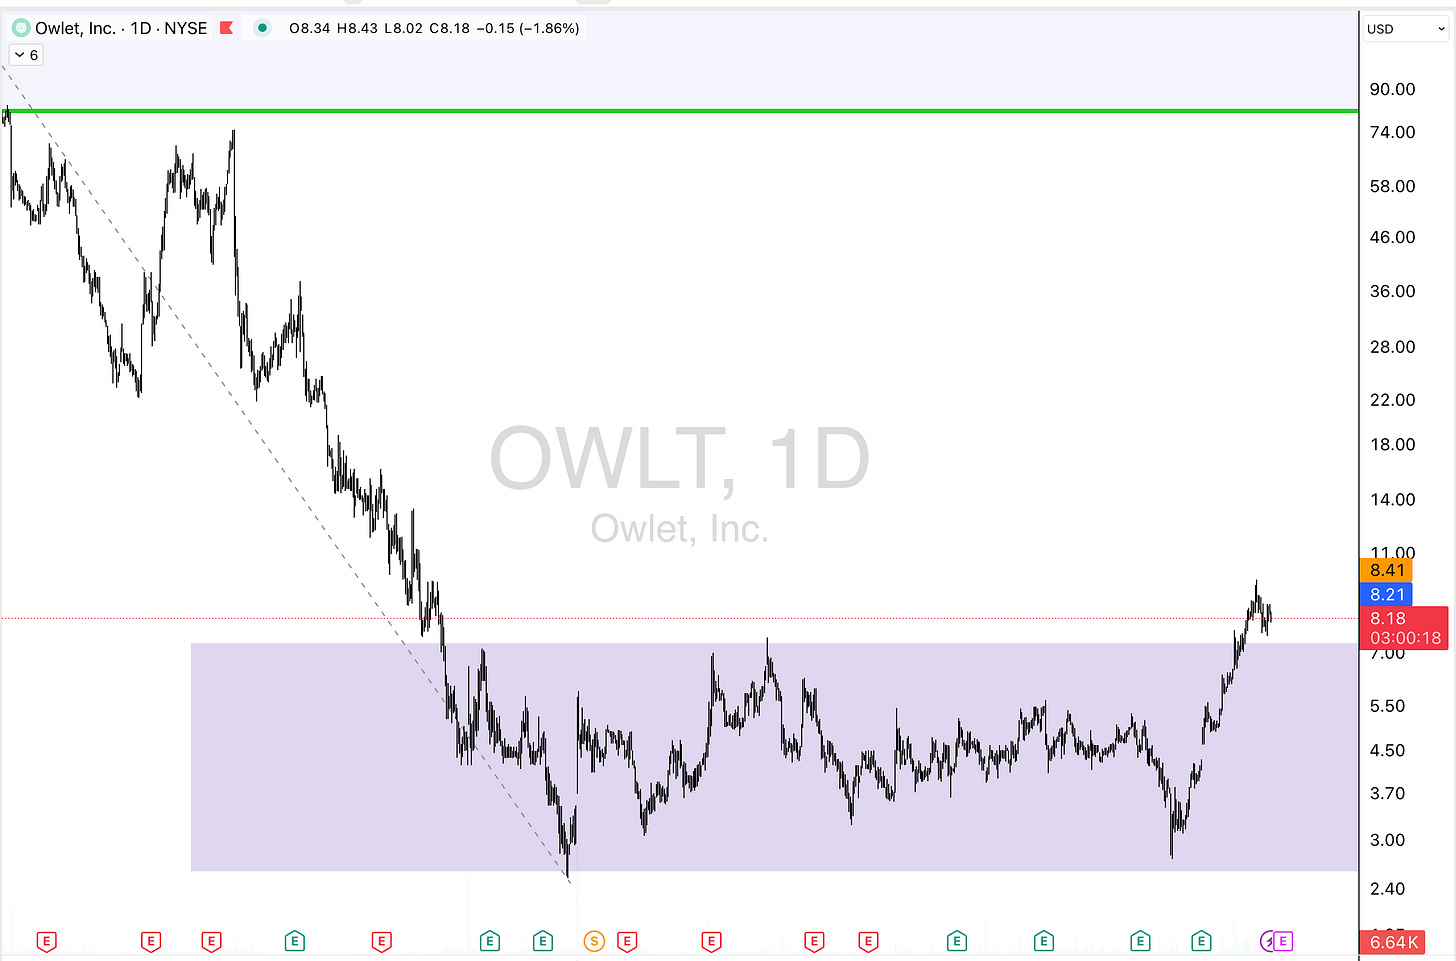
Stocks that completely cratered during the post-SPAC/pandemic era are now basing sideways for months — sometimes years — and just starting to break out of those low bases.
Think names like:
👶 $OWLT – Smart baby monitor tech
🌿 $MSOS – Marijuana ETF
🧬 $DNA – Genomics play
🚲 $PTON – Pandemic boom-and-bust cycle

What’s happening? Rotation.
Big money made in semis like $NVDA now needs a new home. Fund managers aren’t going to cash — they’re hunting for value plays that didn’t die. That’s where this pattern comes in: multi-year downtrends flattening into accumulation zones, followed by a quiet breakout.
✅ The plan? Systematize it.
We’re working on programming this pattern using:
Percent off all-time highs
Flat rate of change over 6–24 months
Recent 52-week breakout
Want to follow this development, or just learn to spot these setups in your own trading?