

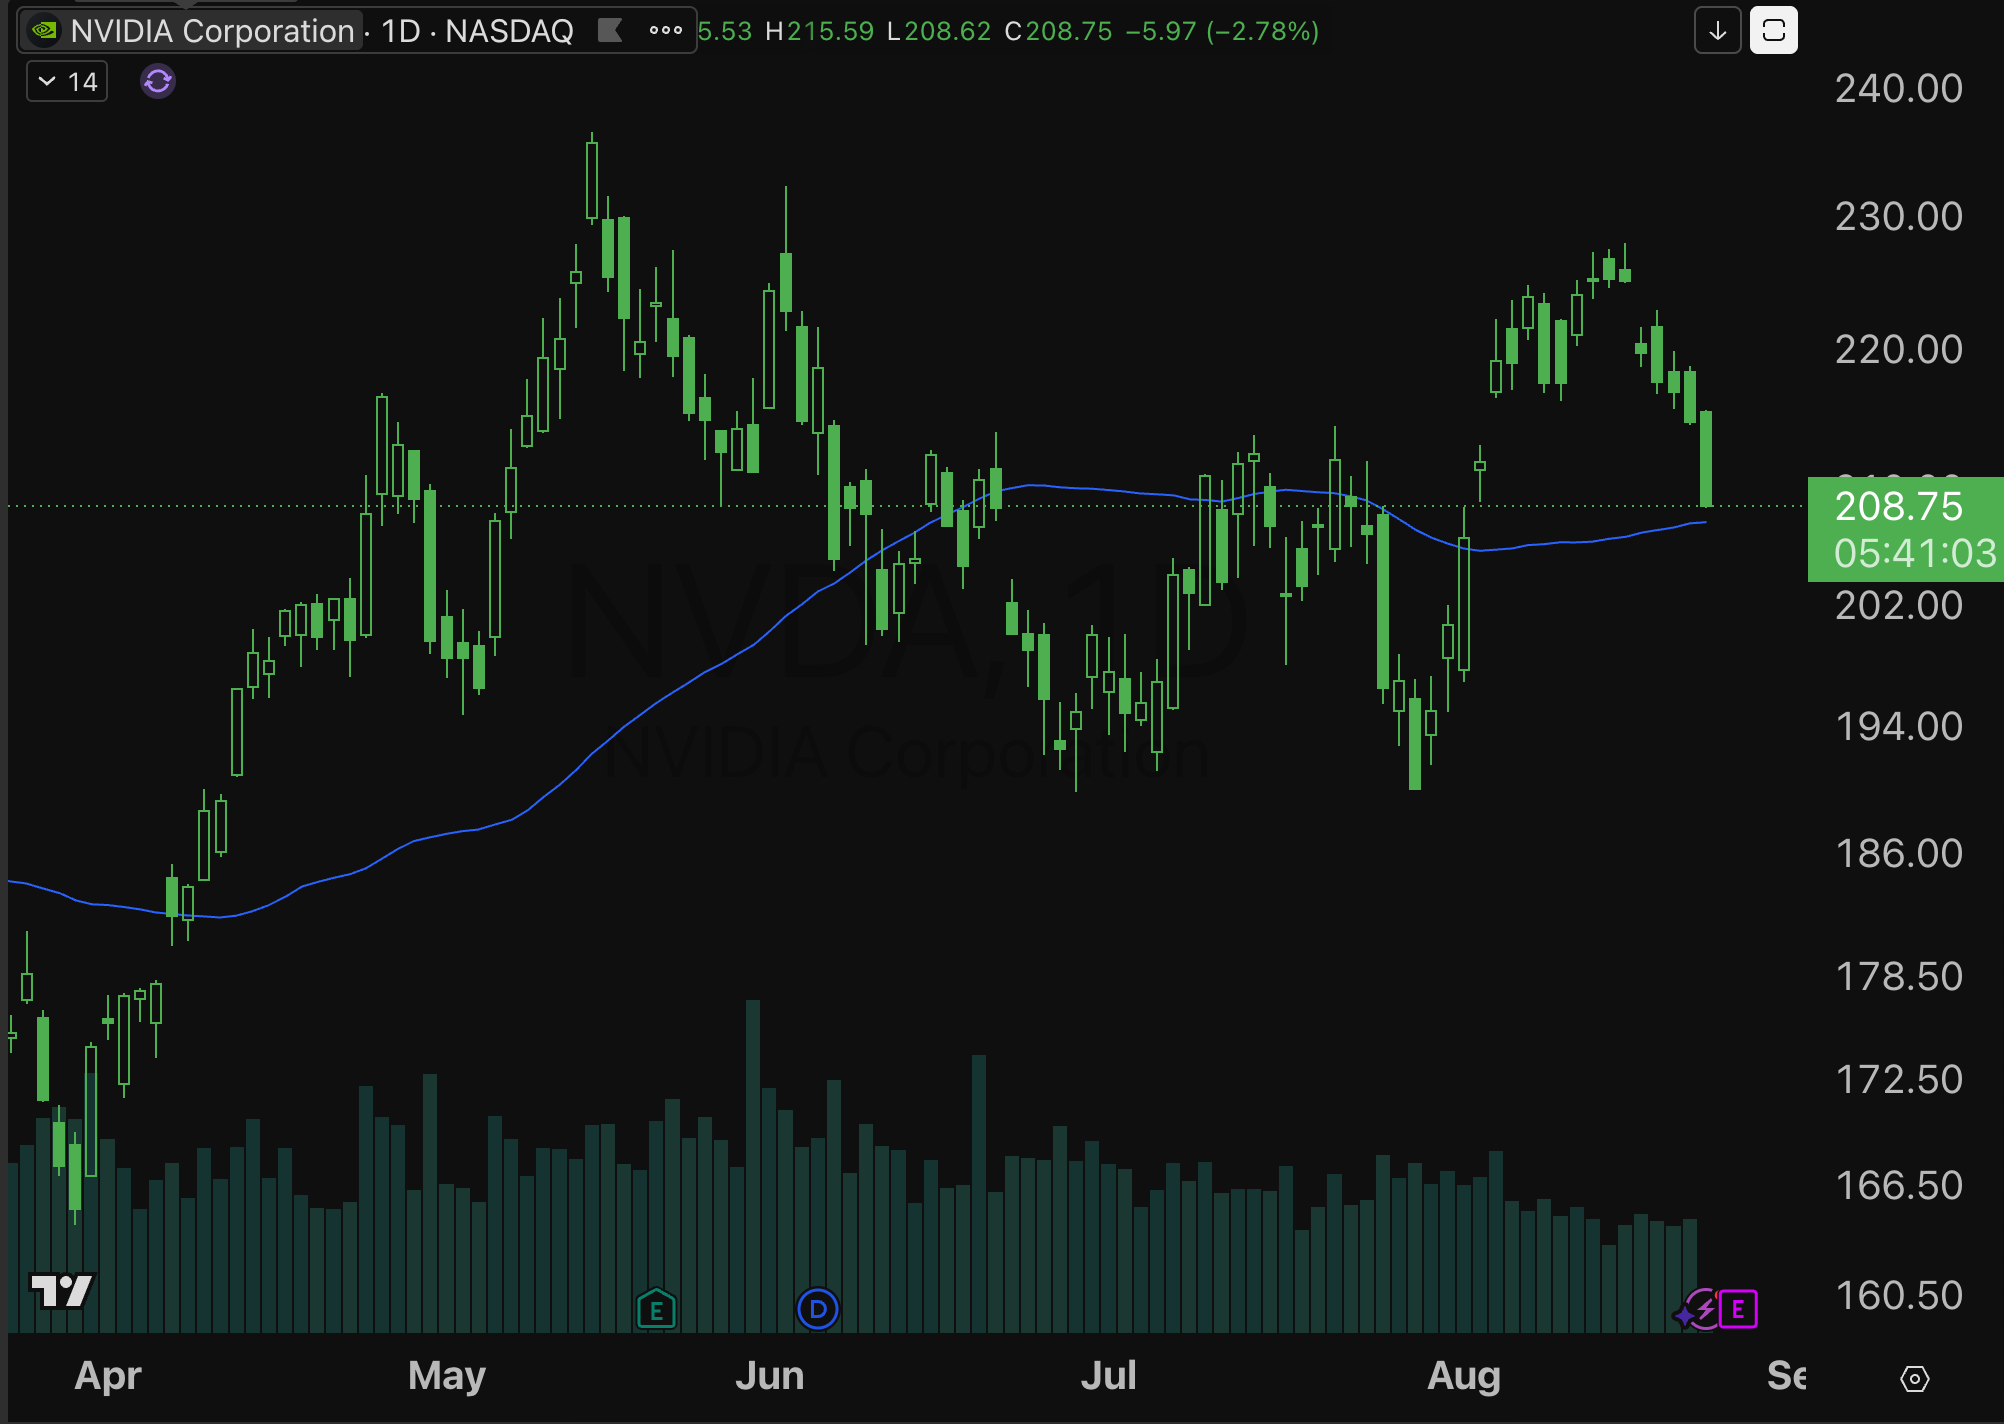
Last quarter Nvidia beat on revenue, beat on EPS, and posted the most profitable quarter any company has ever reported. Then it gapped up and fell roughly 18% from high to low.
That isn’t an anomaly. That’s the pattern.
What twenty years says
The average earnings gap is around 3.5% up. It closes the day up about 2%. A week later it’s barely higher. A month later, it’s positive only about 38% of the time.
More often than not: gap up, then sell.
Why it happens
My theory hasn’t changed. This is the most watched company on earth. Every move Jensen makes has an entourage of analysts trying to work out what’s coming.
There’s nothing left to surprise anyone with. The information is already in the price before the release
.
The thing I’m actually watching
Not the pattern repeating. The pattern breaking.
A gap down that gets bought. A gap up that keeps going instead of drifting. Either would tell me more than another textbook fade.
Because once a trade is this obvious, it stops working. I don’t know if this is the quarter, but eventually it has to be.
The honest caveat
That’s roughly 80 data points across 20 years. Everything we run systematically needs thousands of trades before I’ll trust it.
So this isn’t a signal I’d automate. It’s context for a discretionary decision, which is a different thing and worth being clear about.
Options are currently pricing about a 7% move. The typical move is nearer 3%.
Stats Edge Pro. $149.99 a month, 30-day money-back guarantee.