
Nvidia beats earnings and sells off. Again. Here's 20 years of data.
The gap-and-crap pattern is real. The sample size is small. Both things matter tonight.

Nvidia reports tonight. 8% of the S&P 500. Factor in AMD, Micron, SanDisk, and everything correlated, you’re talking 20-30% of the market moving on one report.
Here’s what 20 years of post-earnings data actually shows.
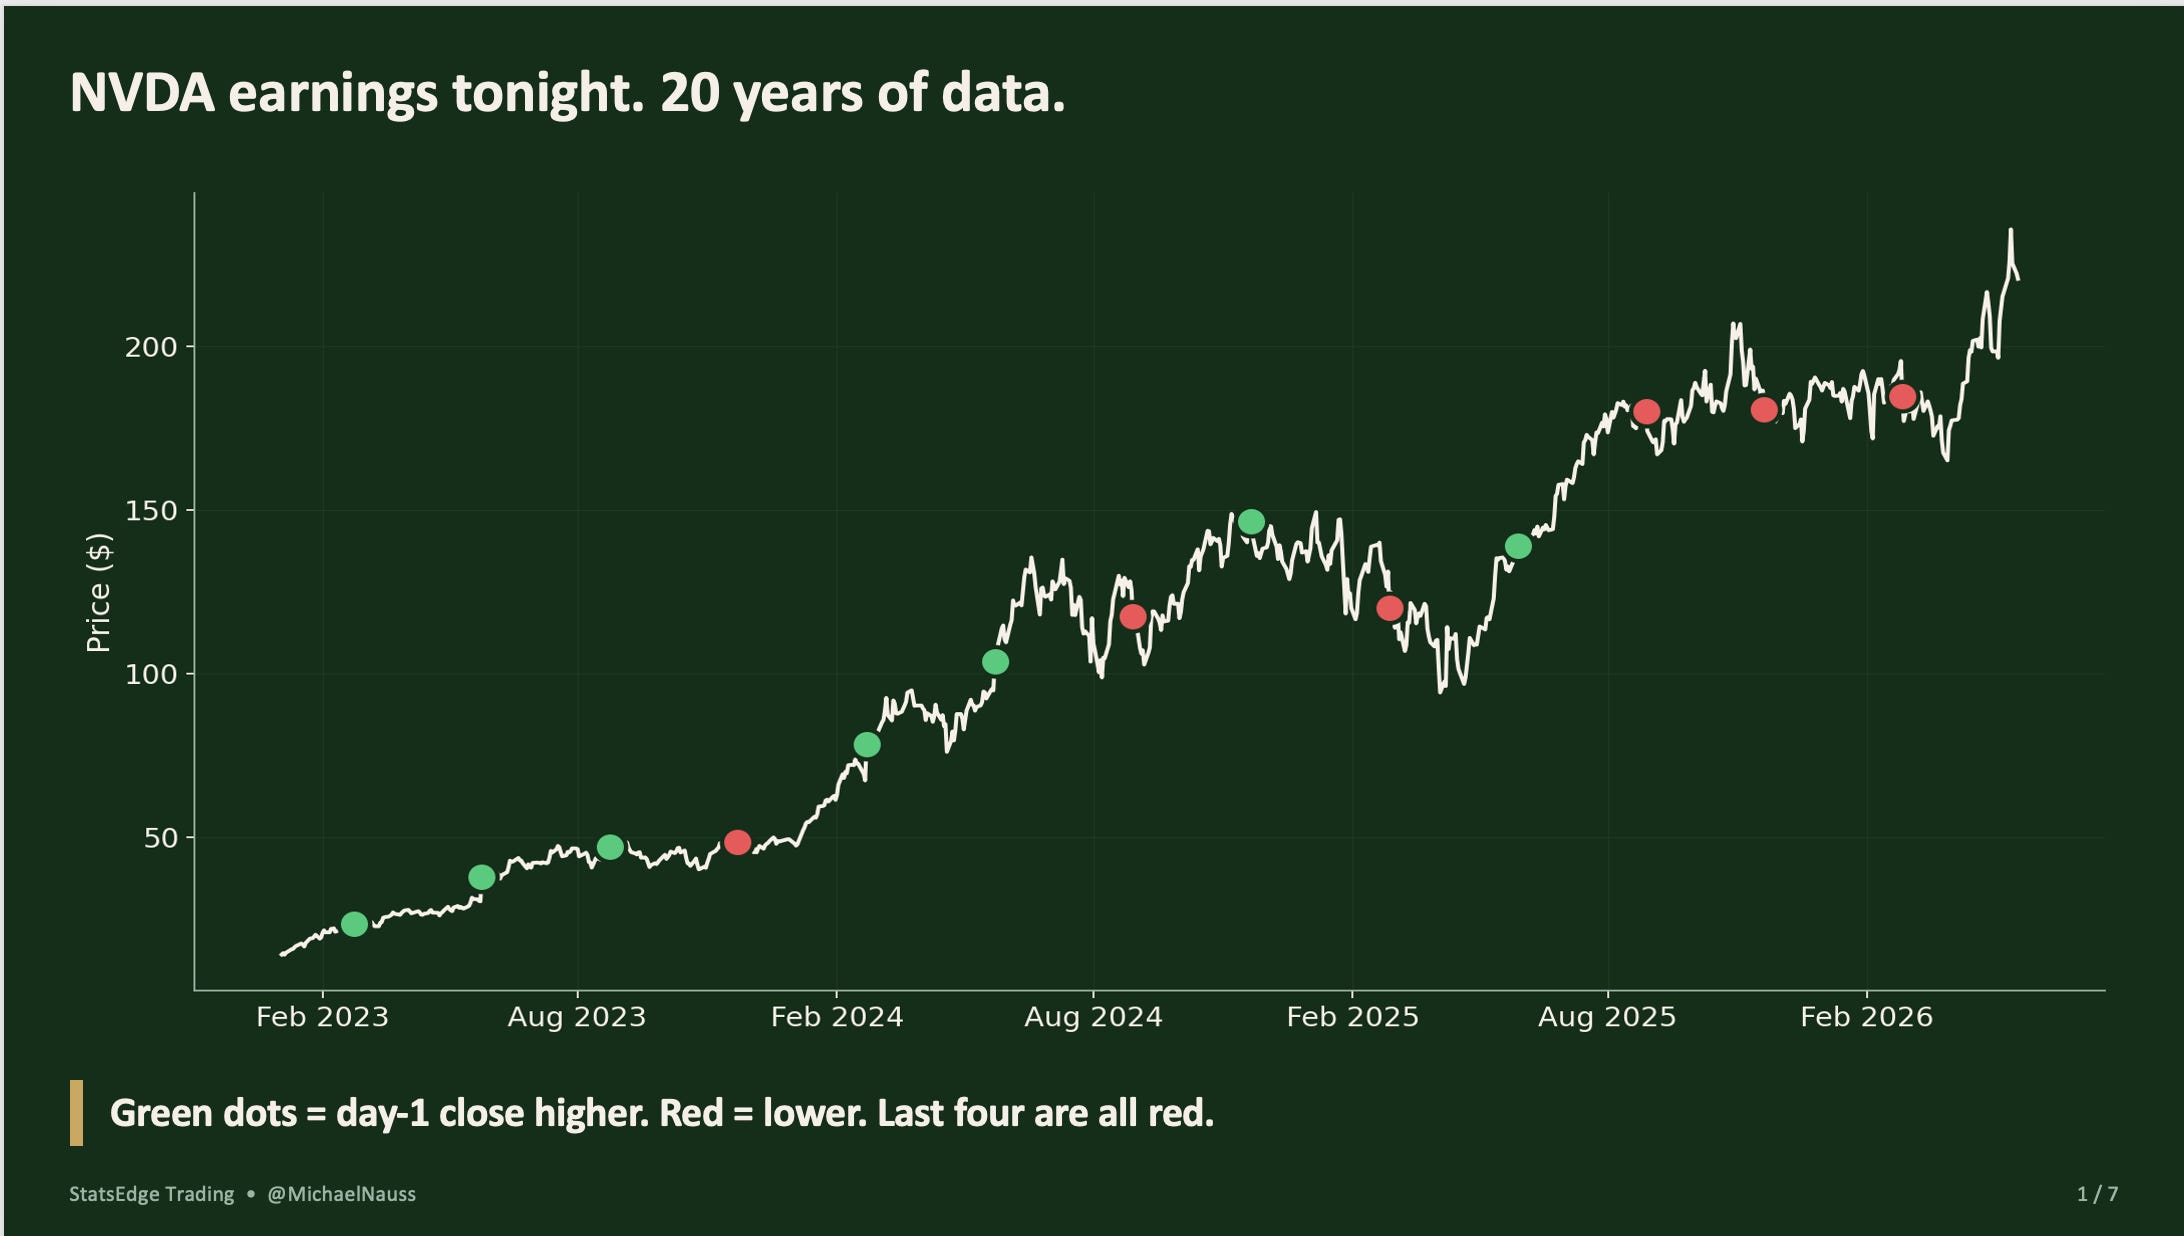
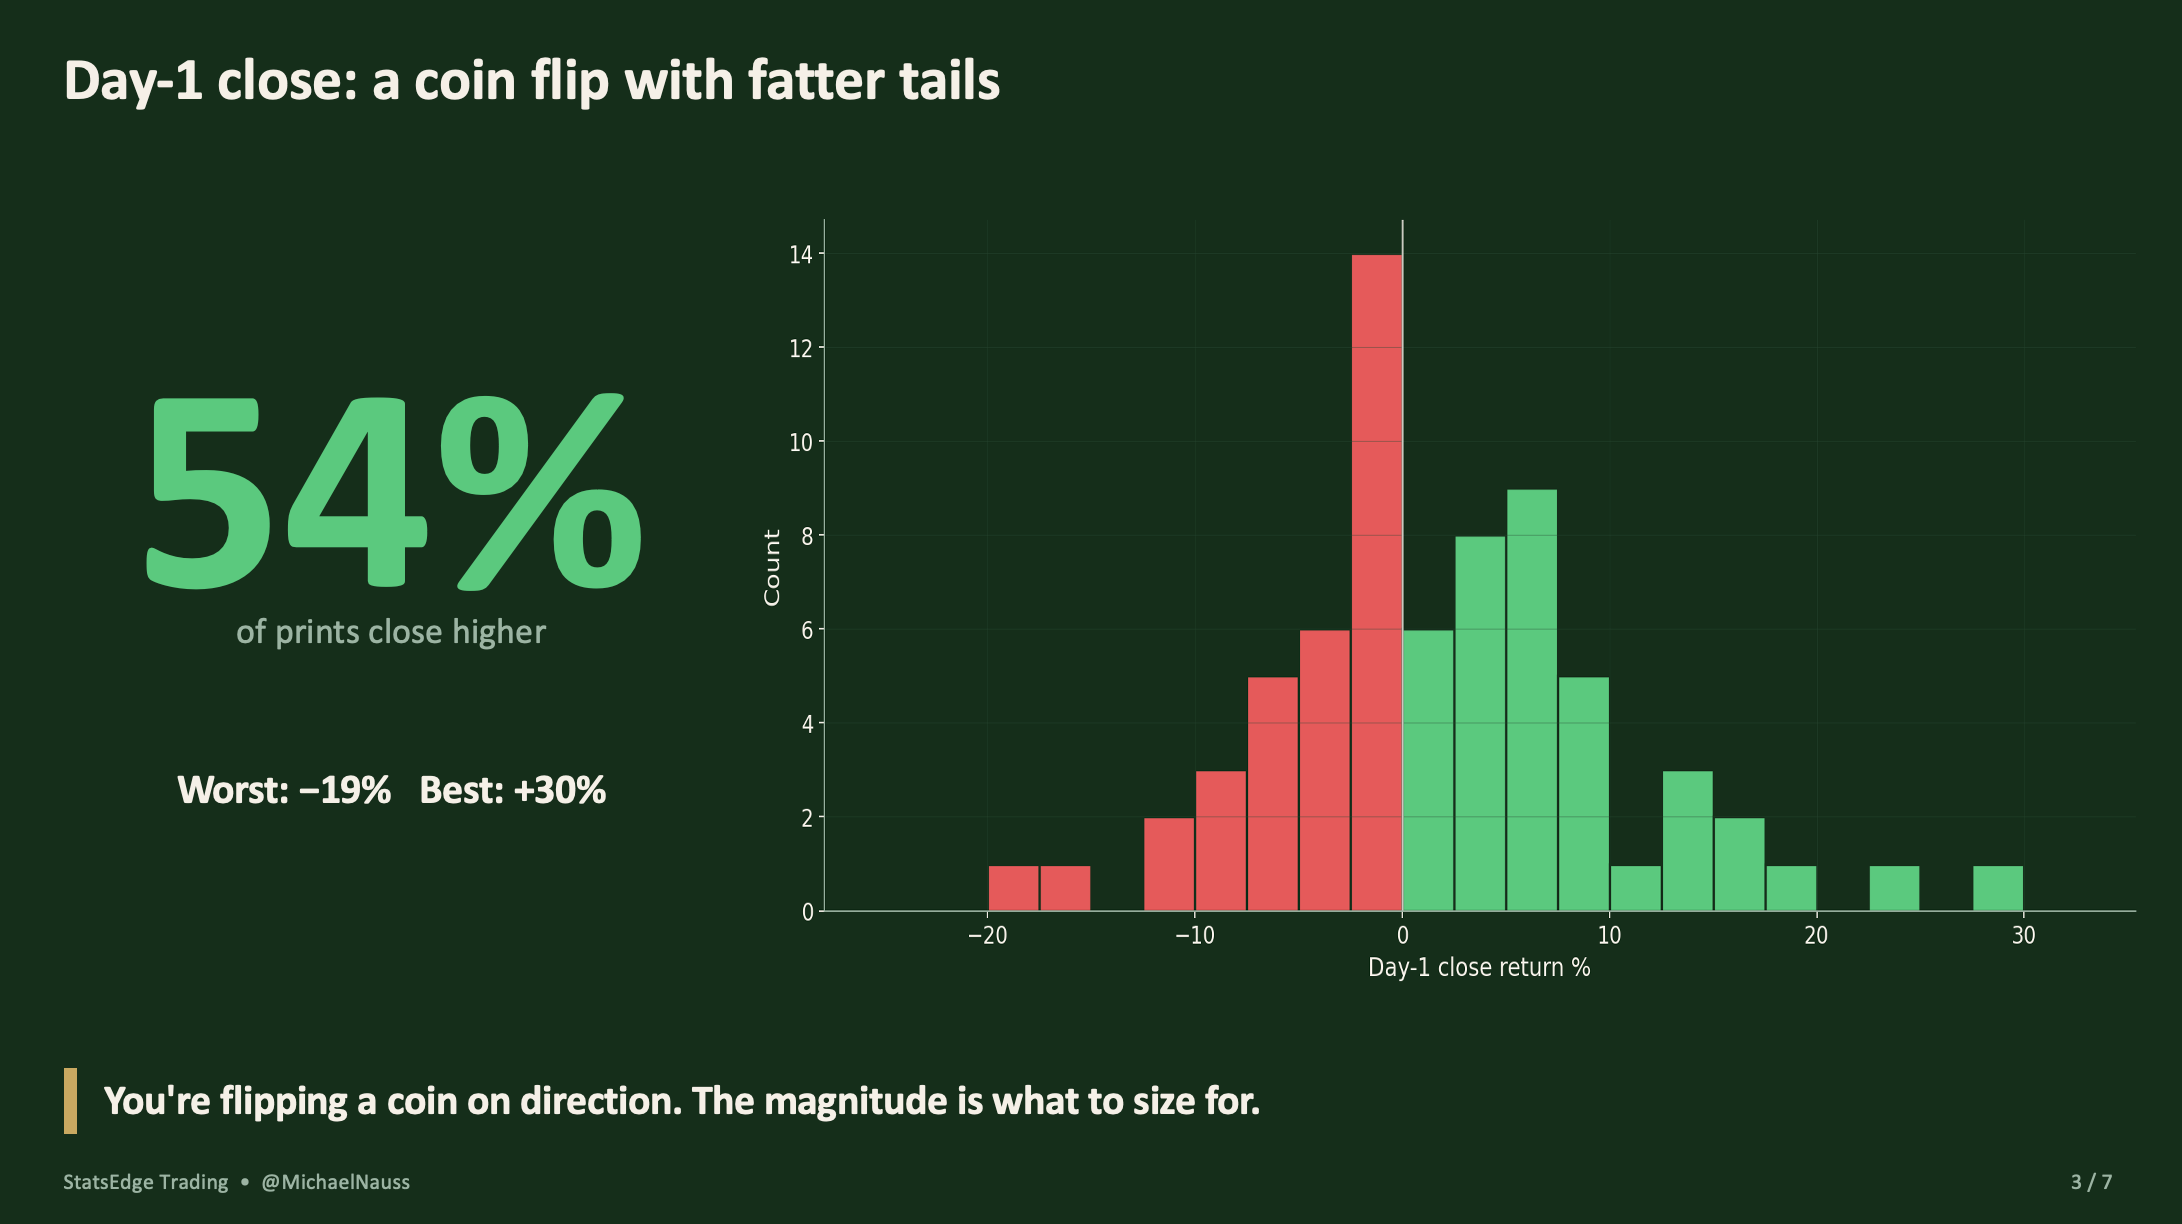
Nvidia beats earnings almost every time. Only one miss in the entire history. Green across the board fundamentally. But the stock gaps up and fades. Over and over. The last 5 years: average gap of +3.5%, but the one-day close shrinks to +2%, and one week out it’s only +1%. One month later, it’s positive just 38% of the time.
The spaghetti chart tells the story. The last four earnings reactions all sold off in the first five days, then chopped sideways. February gapped up and faded. The one before that gapped up 5% and lost 10% on the day. Great numbers, punished stock.
I wouldn’t build a system around 2
0 data points. Every system I bring to Stats Edge Pro has thousands of instances behind it, not 80. But context matters. If this pattern holds again tonight, you’ve got the largest company in the market dragging semiconductors and potentially the broader tape lower for a week. That’s worth knowing even if it’s not tradeable on its own.
17.30% max drawdown over 25 years while the S&P drew down 57%. That number didn’t come from guessing what Nvidia would do after earnings. It came from 52,000+ trades with rules. When those rules produce a losing week, you hear about it in The Drawdown Memo.
Free 25-Year Backtest PDF: https://www.statsedgetrading.com/the-25-year-backtest
Stats Edge Pro at $149.99/month with a 30-day money-back guarantee, or $1,499.99/year. Founding tier at $3,000/year for traders who want a 1:1 onboarding call.
— Michael Nauss, CMT, CAIA, CDMS