
Read This Before You Smash the Sell Button
StatsEdgeTrading

If your heart rate spiked today, that’s human. Big red candles feel like the market is “broken.” It isn’t. This is exactly when a written plan beats adrenaline. At StatsEdge we don’t predict—we execute rules we drafted when we were calm.
Quick definition so we don’t fool ourselves: I don’t label “big” by % change. A –3% day is ordinary in a noisy regime and a true outlier in a quiet one. Percent moves overweight high-volatility tapes. I use ATR to normalize the move to recent range so we’re studying shocks, not headlines
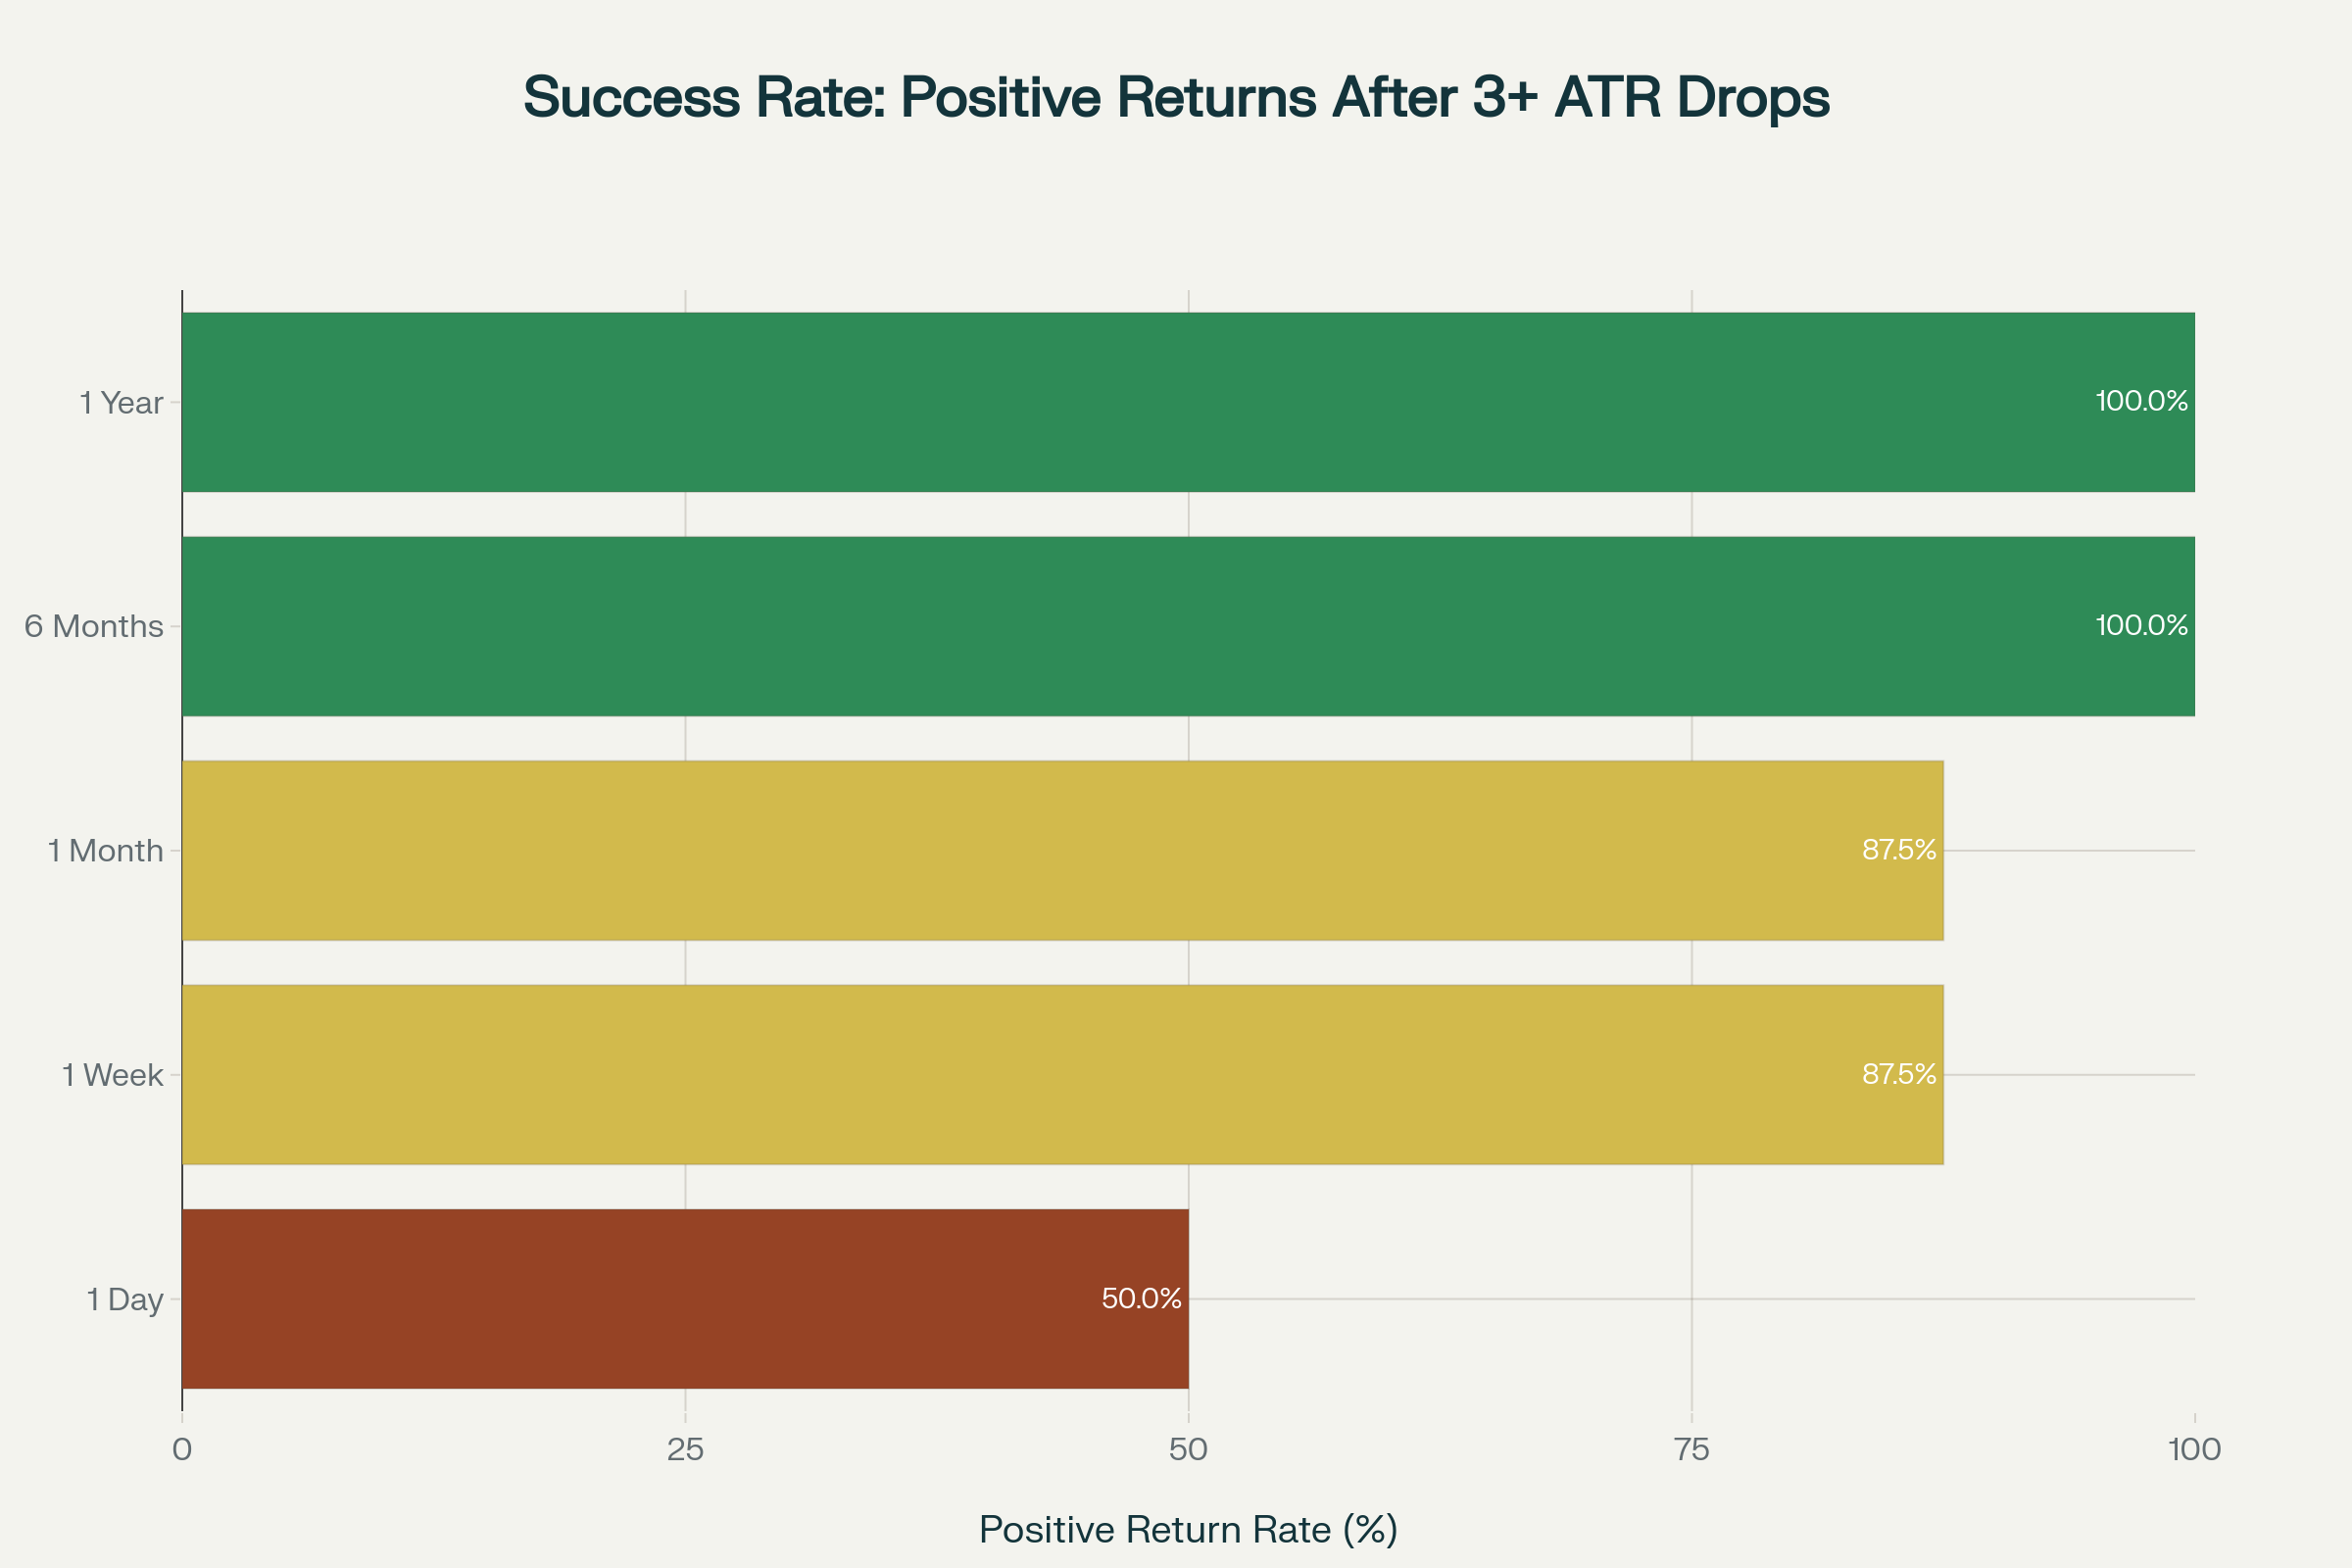
What the data says after 3+ ATR down days in SPY (2015–2025):
Tomorrow ≈ coin flip. Mean next-day return ~0.02%, 50% positive. Translation: acting on panic is mostly regret.
1–4 weeks: odds tilt up. Mean +1.21% (1W) and +2.70% (1M) with ~87.5% positive rates.
6–12 months: constructive. Mean +9.98% (6M) and +19.15% (1Y) with 100% positives in this sample.
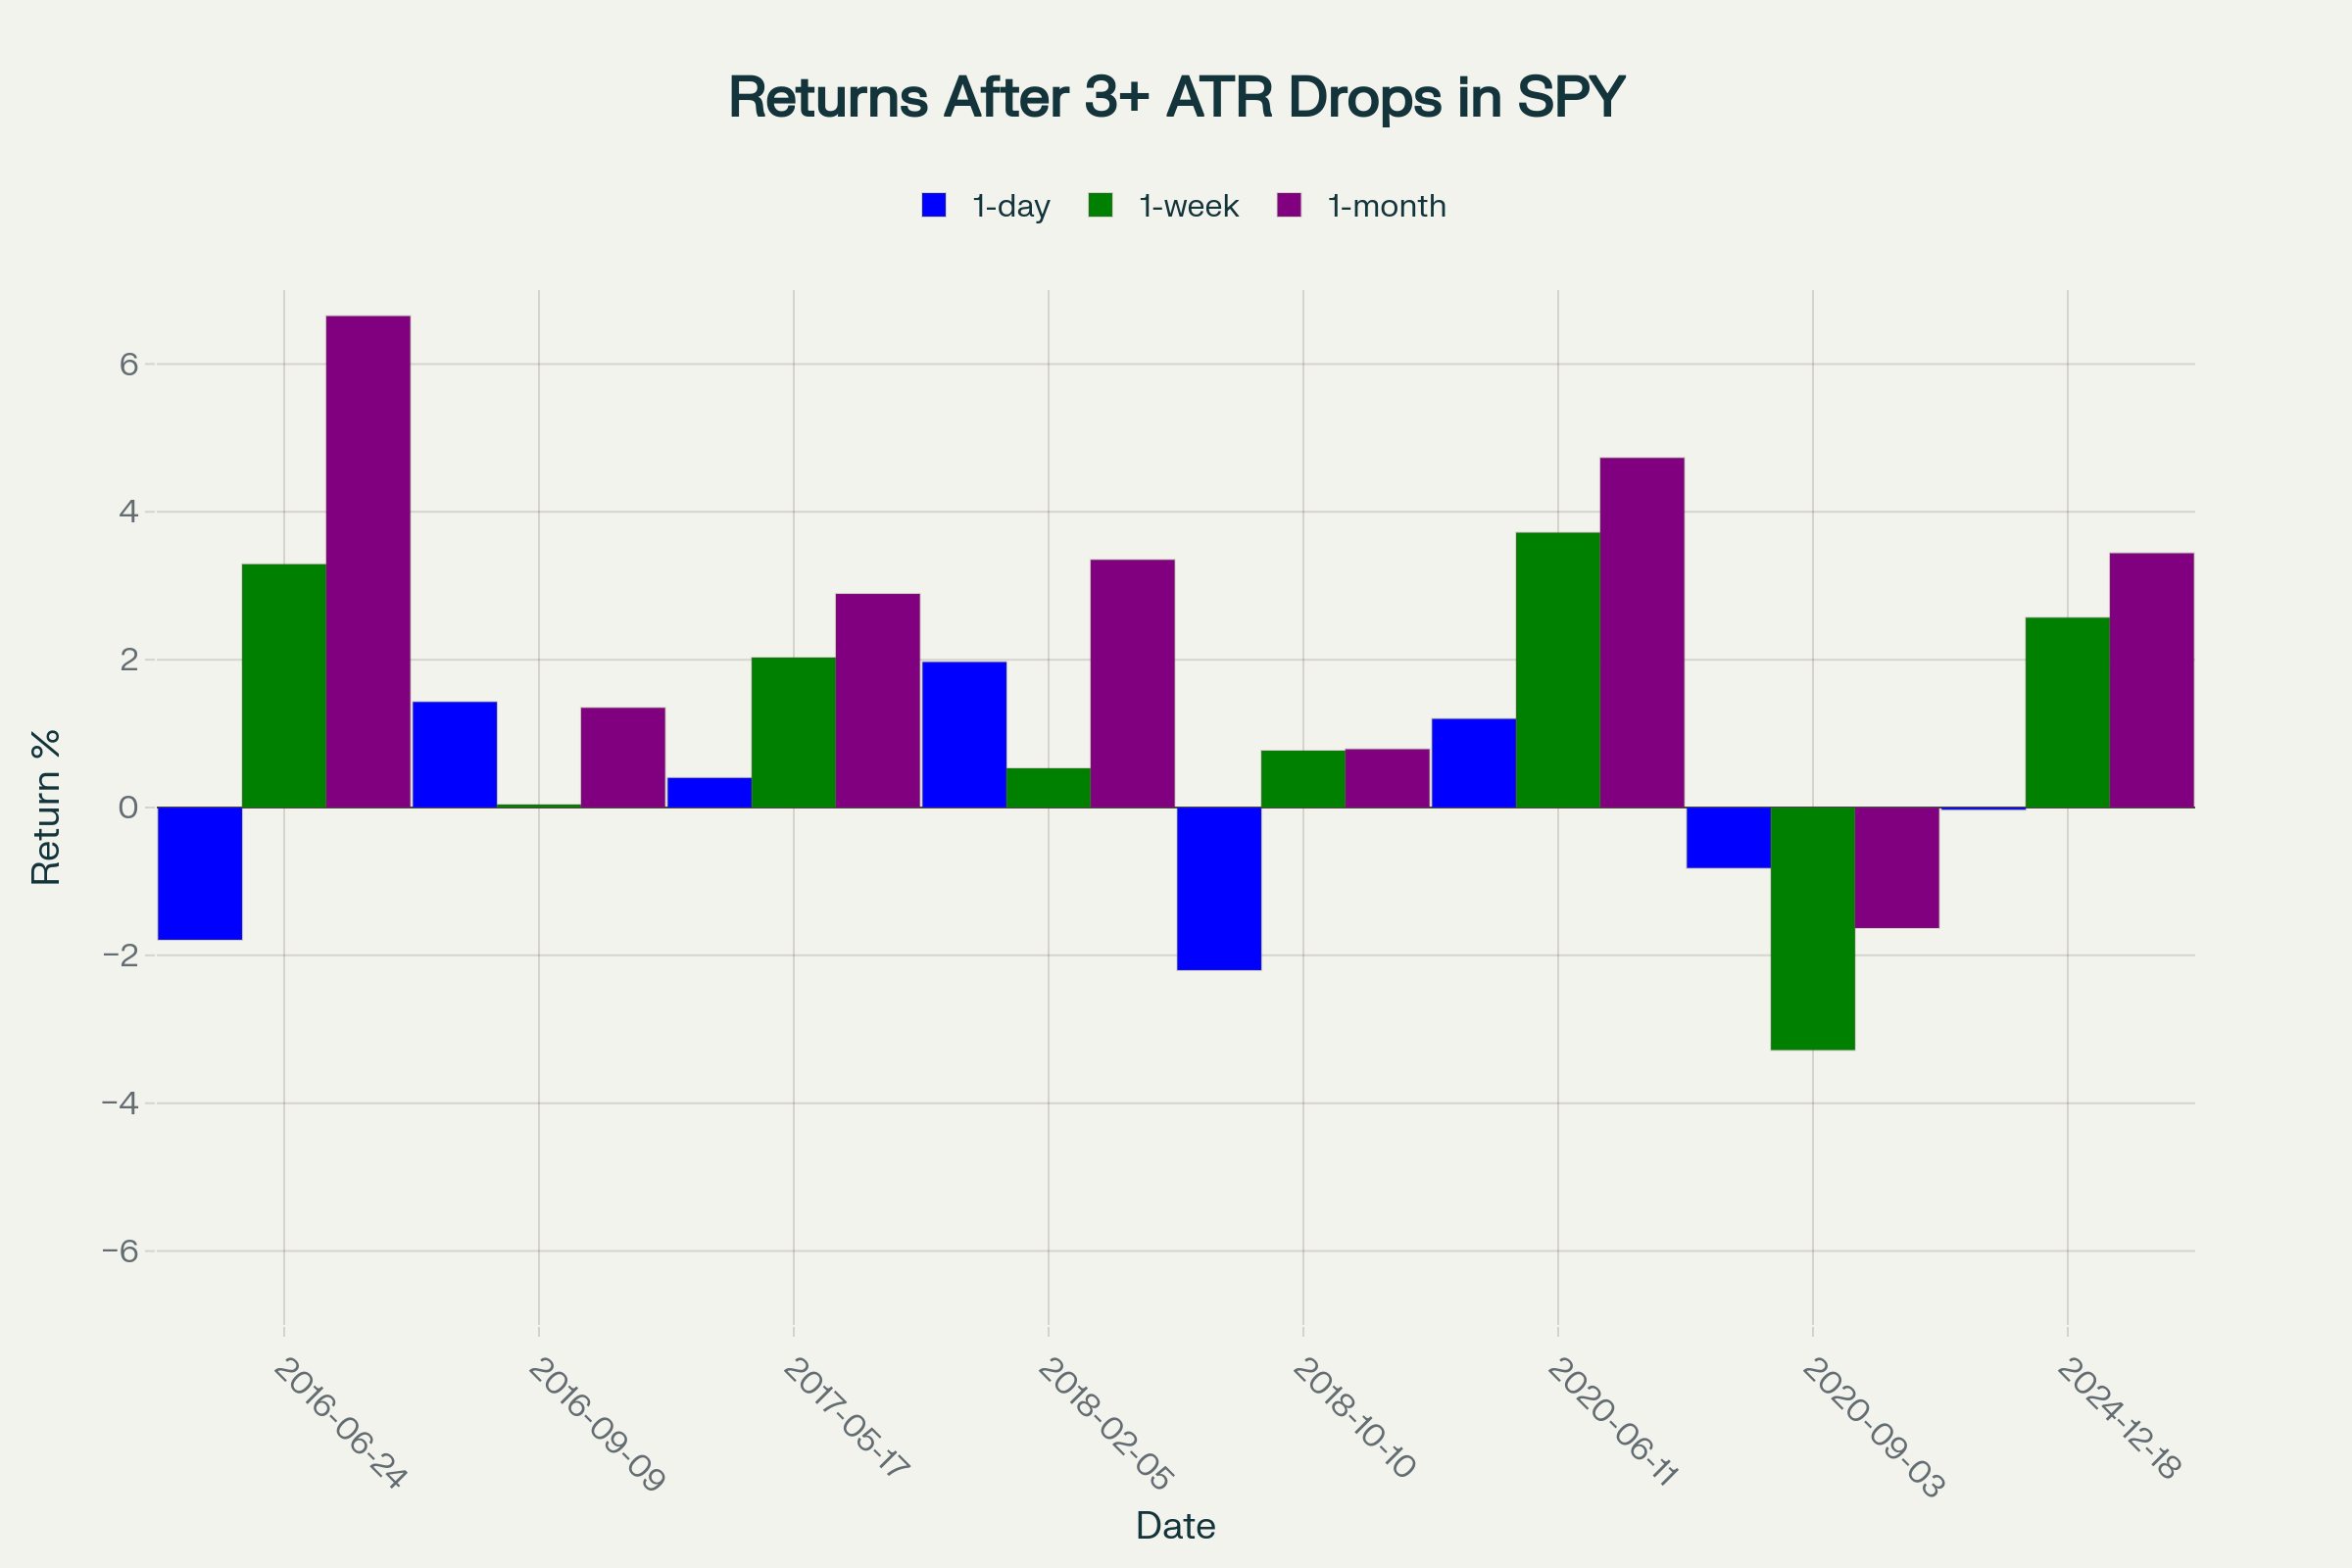
That dispersion view matters: some shocks bounce immediately; others chop or push lower before recovering. You don’t need to guess which path we’re on—you need a plan that works across paths.
After-Shock Checklist — How our process handles moves
Weekly swing plans are the anchor.
Members get a weekend email with a curated swing list and built-in trading plans—entries, exits, and risk laid out—so we already know what we’re looking to buy/sell into the new week. That’s the calm in the storm.Mean-reversion/pullback rules stay mechanical.
We look for names in longer-term uptrends that pulled back hard; entries are pre-set with stops, we don’t chase, and we use a time stop (~one week) so we’re not improvising inside the volatility cluster.Day trading = rules, not revenge.
Intraday systems are fully systematic and idea-based each morning; we let the predefined setups trigger and we’re flat by the close. No “make it back” trades just because the tape is wild.Investing sleeve zooms out.
Monthly models use momentum/relative strength and portfolio allocation to keep decisions higher-timeframe and less reactive to single-day shocks.Combine, don’t over-concentrate.
We run multiple algos that complement one another so one style can work while another rests—smoothing the equity curve when volatility clusters.
That’s the point: process before prediction. ATR tells us we had a shock; the rules tell us what we do about it.
Heads-Up: StatsEdgePro members get their full, ready-to-execute trading plans tomorrow—the weekly swing list with entries/exits, plus the rules we’ll lean on after this flush. Join now so you don’t miss it.
Big down days aren’t a personality test; they’re a systems check. Measure the move in ATRs, let the signals do the talking, and give the statistics a little time to work. Stick to your plan—or use ours until you’ve built your own.
Past performance ≠ future results.