

Once a month I close everything and go through the monthly candles. It takes ten minutes and it resets what actually matters after weeks of noise.
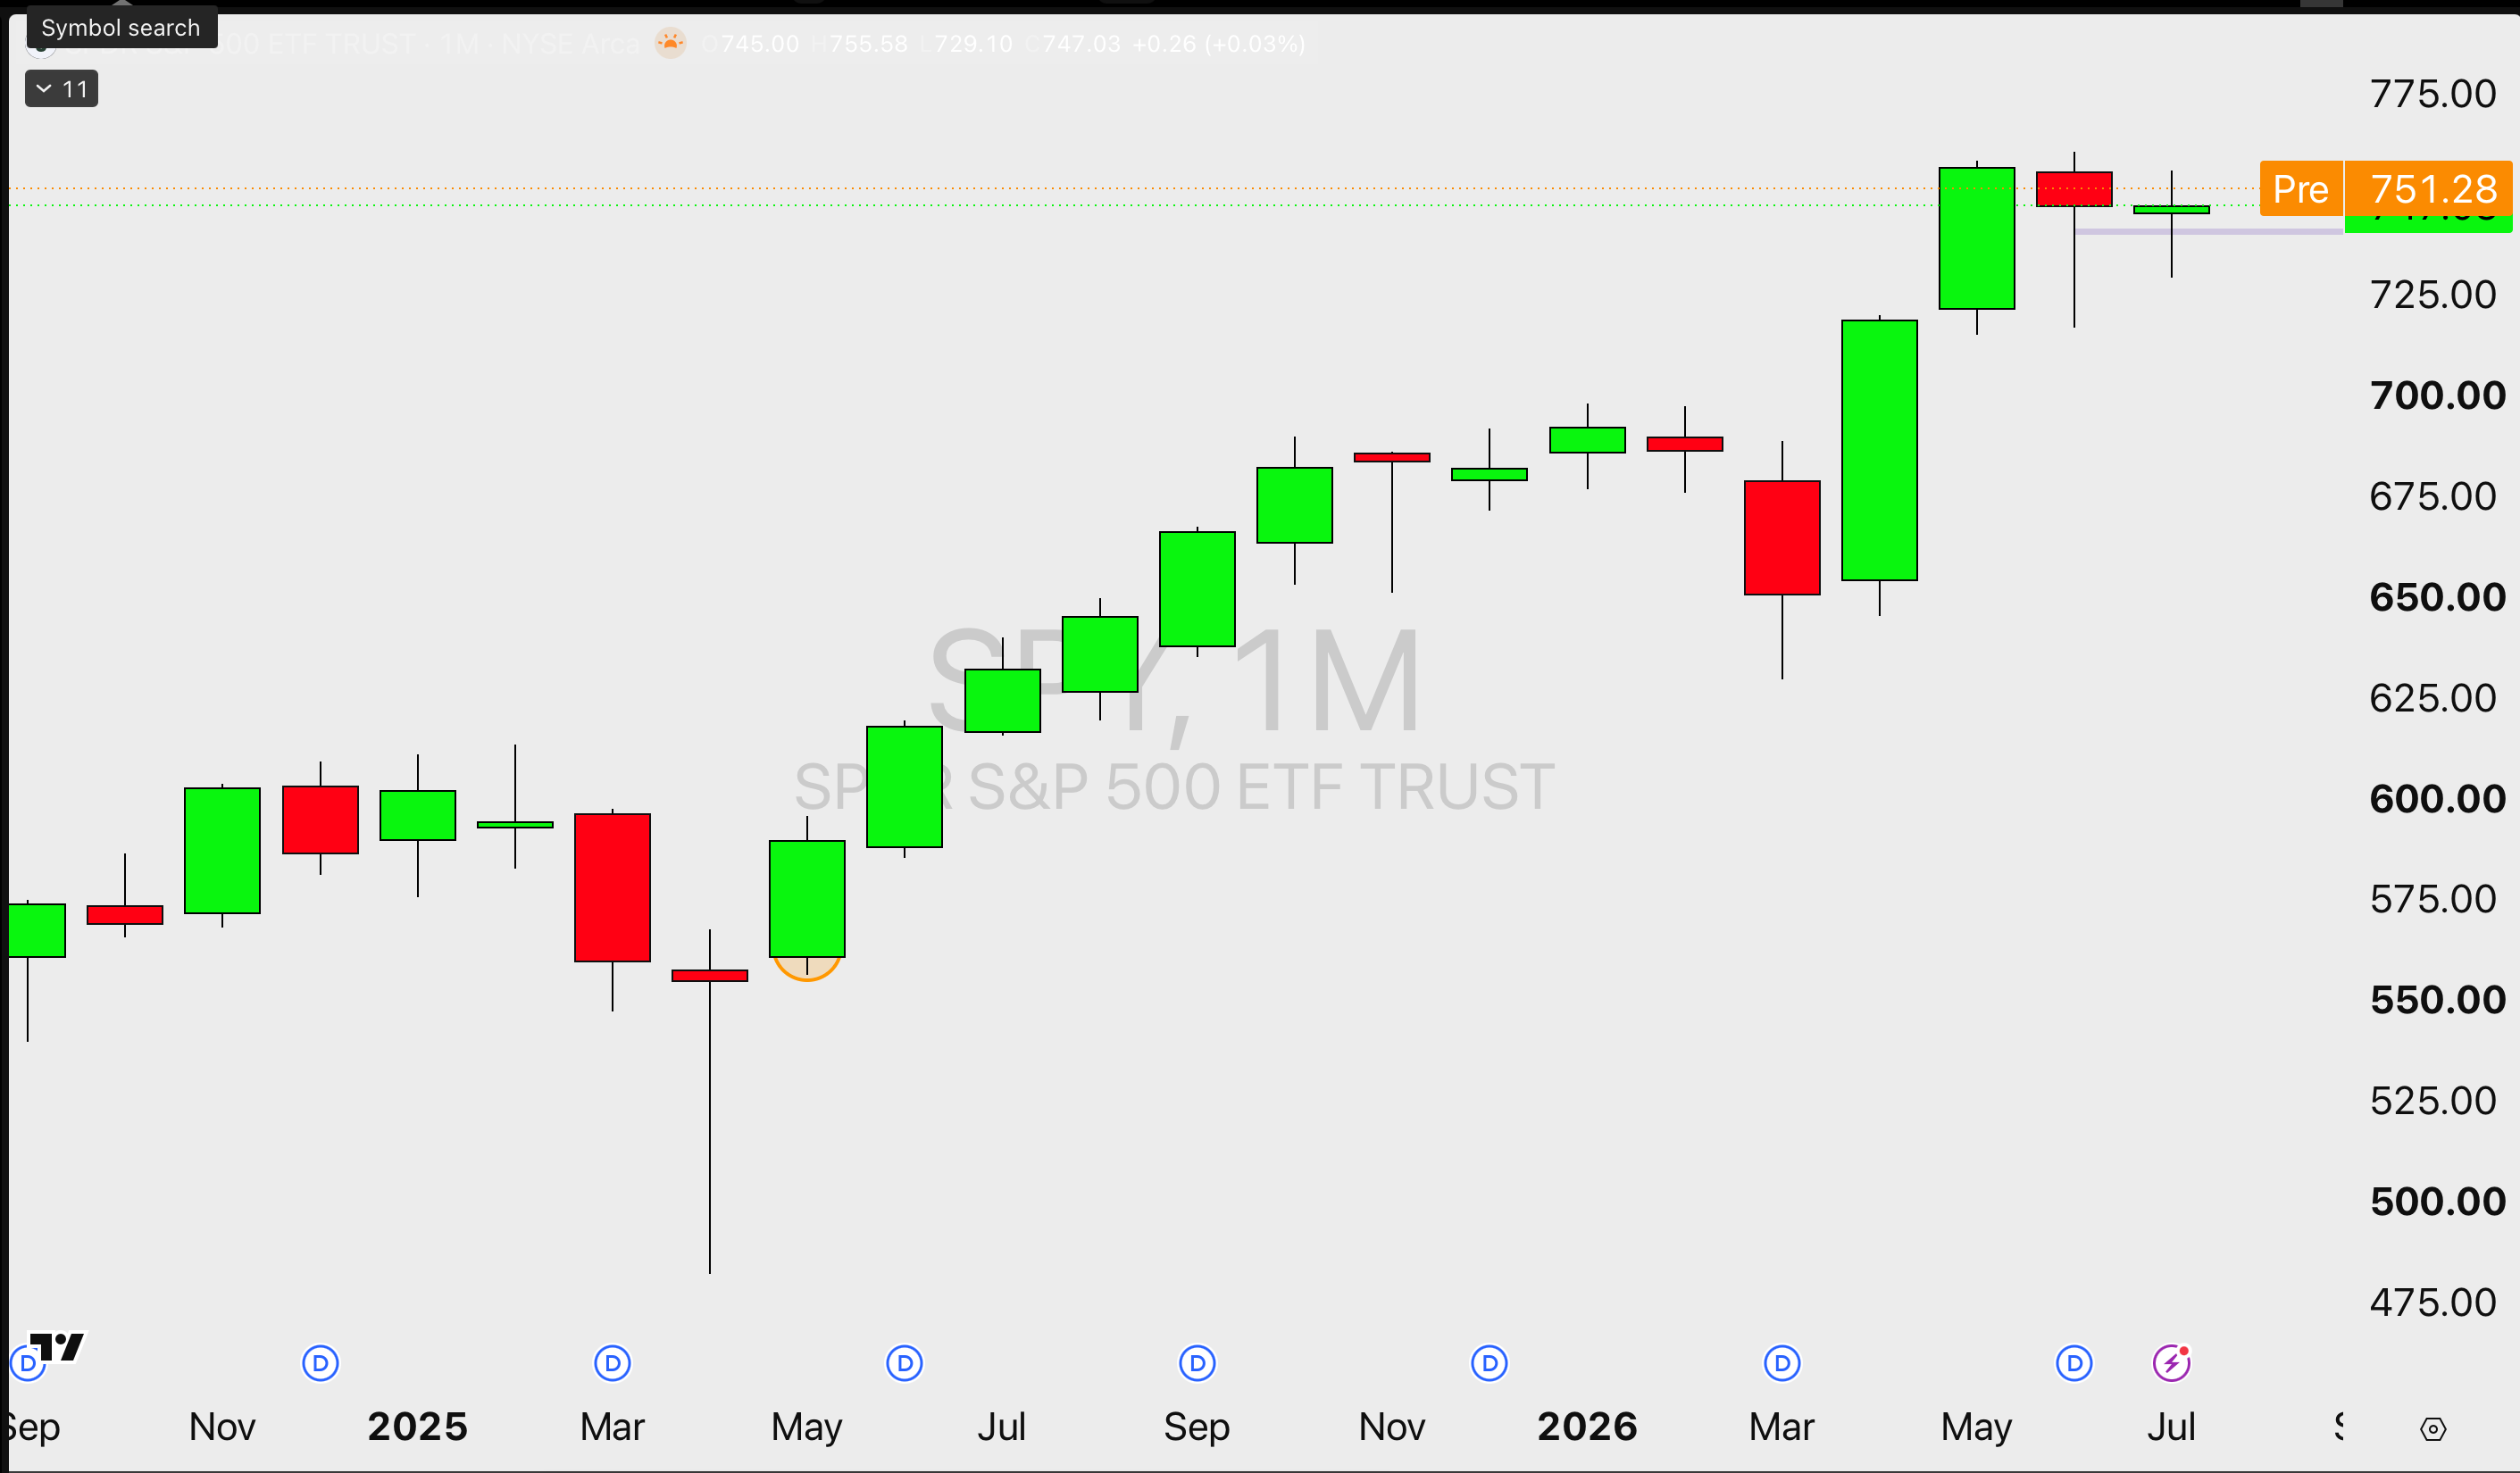
Here is this month in one comparison. The SPY printed a doji, opening and closing at nearly the same price, inside the prior month’s range. Second month in a row of that. Meanwhile RSP, the exact same 500 companies weighted equally, made another all-time monthly closing high.
Same stocks, different math. The only thing that separates them is how much say the giants get, so the divergence is telling you the giants are the drag.
The culprit is one chart. Semiconductors ran from roughly 400 to 700 and gave most of it back in a single month, your SanDisks and Microns getting flushed into the close.
Everything else looks fine. Berkshire is coiling in a tight base near its highs. Healthcare confirmed last month’s breakout. Small caps pulled back but held inside the range. Gold paused after four straight down months.
None of this changes what I trade. Members got their new investment portfolio for the month over the weekend, and daily swing trades started shipping in the new PDF. The systems fire regardless of what I see on a monthly chart, and their drawdowns get published either way.
If you want the systems delivered with entries, stops, and sizing, that’s Stats Edge Pro. $149.99 a month, 30-day money-back guarantee.
Michael Nauss, CMT, CAIA, CDMS