

The S&P 500 bounced off THE level again, small caps closed back over their 200-day, and the calendar is turning friendly right on schedule. Rapid7 has been resting near its highs, and tonight's buy stop only fills if it breaks out of that rest.
Rapid7 is a cybersecurity company whose software scans corporate networks and cloud environments for vulnerabilities and watches for attacks in progress. RPD made a big one-day move up and has stayed in the top half of that day's range since. Tonight's free trade is a buy stop at $18.11, with the stop and exit written out below. Energy fell the most of the sectors on Tuesday.
What caught my eye on Tuesday
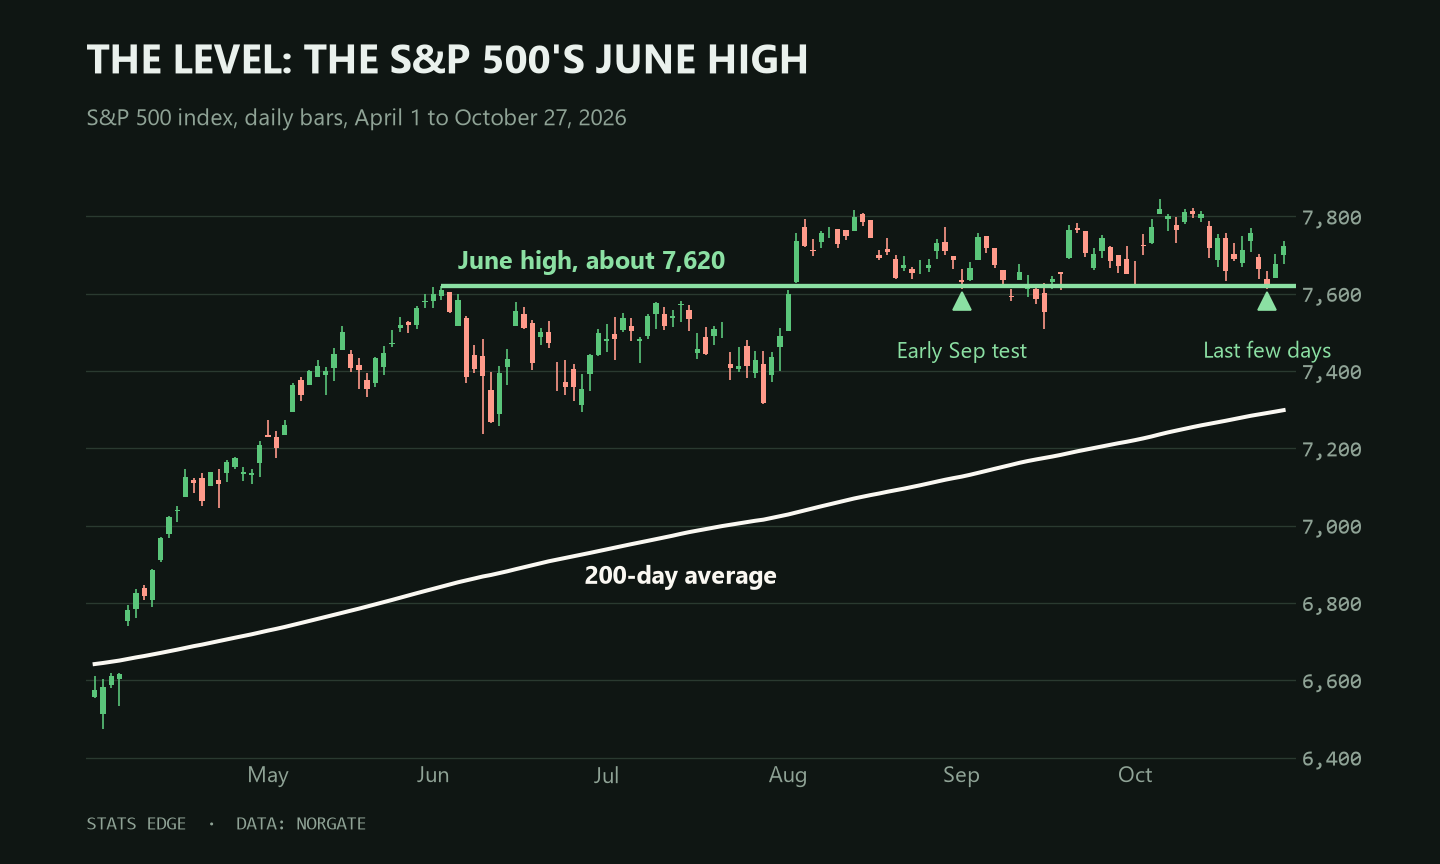
The CMT Association shared my chart of this level today and called it THE level for the markets here. The green line is the S&P 500's June high, about 7,620. It stopped the rally cold in June, the index broke through it in August, and since then it has acted as the floor: buyers stepped in there in early September, the index slipped under it for a few days in mid-September and got straight back above, and in the last few days it has been tested again. Holding here keeps the uptrend that started in April intact. A close well below it would change the picture.
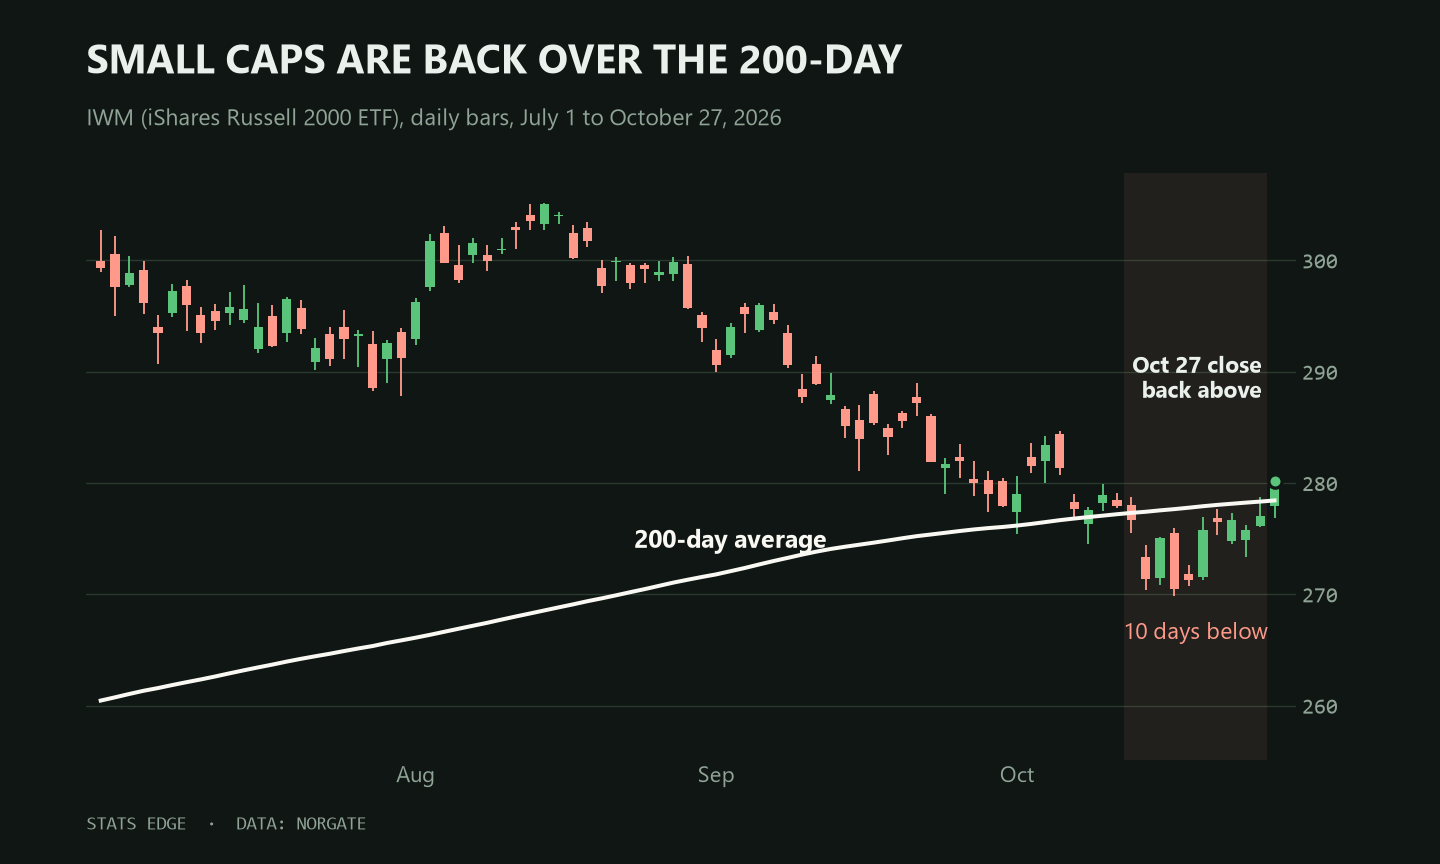
Small caps are back over the 200-day. IWM, the Russell 2000 fund, had held above its 200-day average since the end of March, then slid about 11% from its August high and spent two weeks under it this month. Today it closed back above, and the average itself is still rising. When small caps join in, the rally is broader than just the biggest names.
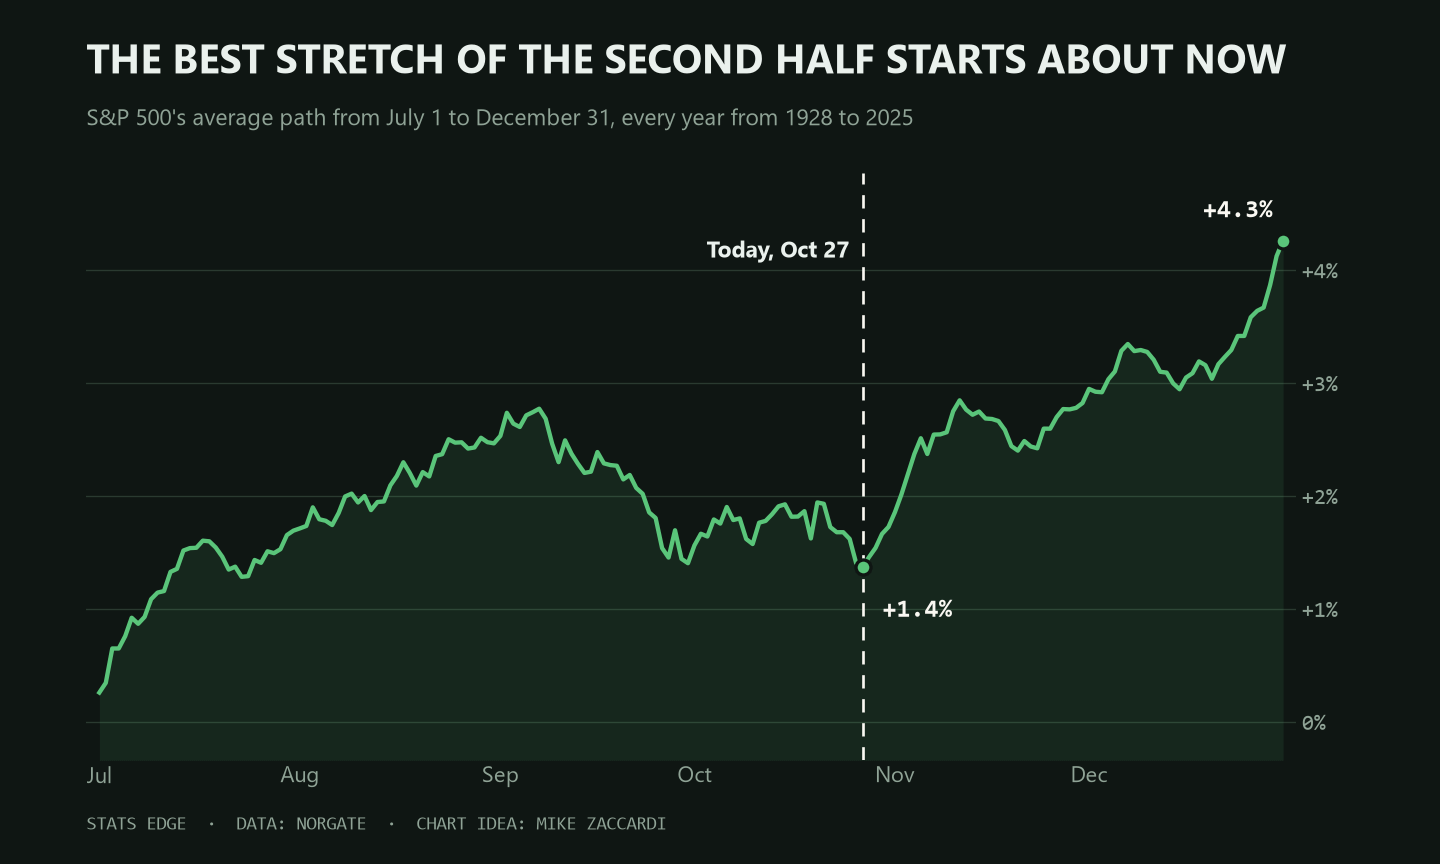
The calendar is lining up with it, too. This chart shows the S&P 500's average path through the second half of the year, every year since 1928, and the dashed line is today. In the average year, the fall dip bottoms right about now: the index is up about 1.4% from July 1 to here, then gets to about 4.3% by New Year's Eve, roughly another 3% from here, and it rose over that stretch in about 7 years out of 10. It is an average, not a promise, and plenty of years go their own way. But if you have been waiting for the calendar to turn friendly, history says it usually does about now.
Tonight's free trade: RPD
Buy stop $18.11, day order
Target: sell limit $24.31, good till cancelled
Stop: sell stop $15.01, good till cancelled
Time exit: sell at the open Thu Dec 3
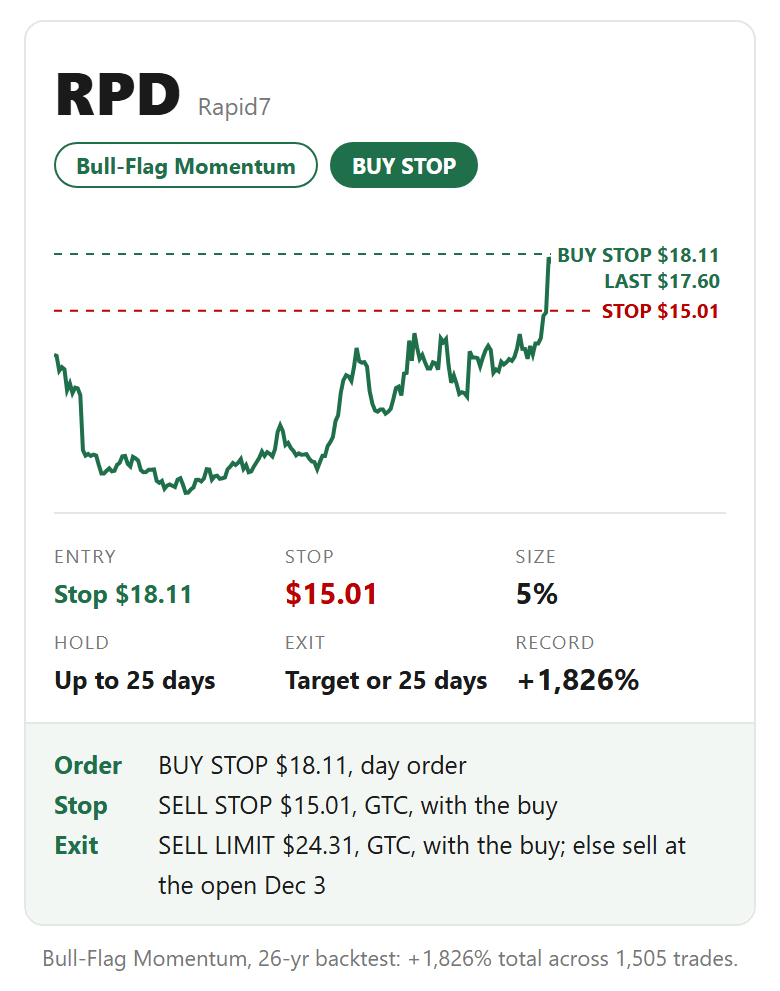
The stop is a real order: enter it with the buy. The system re-sets it after every close, and members get each new level. When the target or the stop fills, cancel the other. Cancel both before you sell on the time exit.
How Bull-Flag Momentum works
A stock shows exceptional power, then rests quietly without giving back its gains - the crowd that missed the move is waiting underneath. We buy the actual resumption of the advance - never the rest itself - and a structure under the rest period defines the risk. Low win rate, big winners - the math lives in the asymmetry.
One thing worth knowing
Bull flags did not need a rising market. In our test since 2001, Bull-Flag Momentum trades bought while the Nasdaq 100's short-term trend pointed up made +0.61% on average. Trades bought when it did not made +2.06%, more than three times as much.
Would you take this one? Hit reply and tell me how you'd play it. I read every reply.
Below: the rest of tonight's ideas, the exact orders, and how we're managing the open positions.